Changelog Listener
A common use case of Self-Service Actions is listening to changes in the software catalog and reacting to them.
For example:
- When the CPU utilization % of a DB crosses the 80% mark, you might want to trigger a job that closes stale connections, kills stalled queries, or ensures everything is behaving correctly.
- When the health check status of a microservice deployment goes from
healthytodegraded, you might want to perform some scale-up or scale-out operation, or perhaps send an alert message to the responsible microservice team's slack channel to make sure the on-call is aware of the issue.
Goal
In the following example, you will create a changelog listener that can react to changes in Port in a customized manner.
To implement the listener, use the following:
- Python with FastAPI - to setup an API that will handle webhook requests;
- Smee.io and pysmee - to redirect webhook requests to your local API;
- Port's changelog capabilities - to send an event to your API every time something changes in your software catalog;
- Slack webhooks - to send a message to your slack server, alerting your users of the change.
Your API will be triggered every time a change occurs to your deploymentConfig Blueprint, or one of its Entities.
A message will be sent to Slack every time the healthStatus field of your Entity changes.
Create a webhook URL with Smee
Go to smee.io and click on Start a new channel, you should see your webhook proxy URL at the top of the page. You will use it to specify the webhook destination in the next section.
Creating the deployment config Blueprint
A deployment config is used to represent a service deployment, in a specific environment in your infrastructure. A deployment config has multiple deployments tied to it, each representing a new version of the deployed code of the matching service, in the matching environment.
A deployment config is also just what it sounds like - a config, which means it is a good place to store runtime variables and values, links to logging, tracing, or dashboard tools and more static data that does not change between deployments.
For this limited example, the deployment config Blueprint will include mostly status properties that are likely to change frequently, thus showing Port's changelog listener capabilities:
Deployment Config Blueprint JSON
{
  "identifier": "deploymentConfig",
  "title": "Deployment Config",
  "icon": "Microservice",
  "schema": {
    "properties": {
      "healthStatus": {
        "type": "string",
        "title": "Health Status",
        "enum": ["Healthy", "Degraded", "Crashed", "Restarting"],
        "enumColors": {
          "Healthy": "green",
          "Degraded": "orange",
          "Crashed": "red",
          "Restarting": "yellow"
        }
      },
      "cpuUtil": {
        "type": "number",
        "title": "CPU Utilization"
      },
      "memoryUtil": {
        "type": "number",
        "title": "Memory Utilization"
      },
      "newRelicUrl": {
        "type": "string",
        "format": "url",
        "title": "New Relic",
        "description": "Link to the new relic dashboard of the service"
      },
      "sentryUrl": {
        "type": "string",
        "format": "url",
        "title": "Sentry URL",
        "description": "Link to the new sentry dashboard of the service"
      },
      "prometheusUrl": {
        "type": "string",
        "format": "url",
        "title": "Prometheus URL"
      },
      "locked": {
        "type": "boolean",
        "title": "Locked",
        "default": false,
        "description": "Are deployments currently allowed for this configuration",
        "icon": "Lock"
      }
    },
    "required": []
  },
  "mirrorProperties": {},
  "calculationProperties": {},
  "relations": {},
  "changelogDestination": {
    "type": "WEBHOOK",
    "url": "YOUR_WEBHOOK_URL"
  }
}
Remember that in order to report changelog events to a webhook, you need to provide the changelogDestination key in the Blueprint definition.
In addition, below you can find a deployment config Entity matching the Blueprint schema:
Deployment Config Entity JSON
{
  "identifier": "notification-service-prod",
  "title": "Notification Service Production",
  "properties": {
    "healthStatus": "Healthy",
    "cpuUtil": 25,
    "memoryUtil": 30,
    "newRelicUrl": "https://newrelic.com",
    "sentryUrl": "https://sentry.io/",
    "prometheusUrl": "https://prometheus.io",
    "locked": false
  },
  "relations": {}
}
Below is a python code snippet to create both the deployment config Blueprint and Entity:
Remember to replace the placeholders for YOUR_CLIENT_ID, YOUR_CLIENT_SECRET and YOUR_WEBHOOK_URL with your Port client ID, secret and your webhook URL (or Smee proxy URL).
Click here to see the code
import requests

CLIENT_ID = 'YOUR_CLIENT_ID'
CLIENT_SECRET = 'YOUR_CLIENT_SECRET'
WEBHOOK_URL = 'YOUR_WEBHOOK_URL'

API_URL = 'https://api.getport.io/v1'

target_blueprint = 'deploymentConfig'

credentials = {'clientId': CLIENT_ID, 'clientSecret': CLIENT_SECRET}

token_response = requests.post(f'{API_URL}/auth/access_token', json=credentials)

access_token = token_response.json()['accessToken']

headers = {
    'Authorization': f'Bearer {access_token}'
}

blueprint = {
    "identifier": target_blueprint,
    "title": "Deployment Config",
    "icon": "Microservice",
    "schema": {
        "properties": {
            "healthStatus": {
                "type": "string",
                "title": "Health Status",
                "enum": ["Healthy", "Degraded", "Crashed", "Restarting"],
                "enumColors": {
                    "Healthy": "green",
                    "Degraded": "orange",
                    "Crashed": "red",
                    "Restarting": "yellow"
                }
            },
            "cpuUtil": {
                "type": "number",
                "title": "CPU Utilization"
            },
            "memoryUtil": {
                "type": "number",
                "title": "Memory Utilization"
            },
            "newRelicUrl": {
                "type": "string",
                "format": "url",
                "title": "New Relic",
                "description": "Link to the new relic dashboard of the service"
            },
            "sentryUrl": {
                "type": "string",
                "format": "url",
                "title": "Sentry URL",
                "description": "Link to the new sentry dashboard of the service"
            },
            "prometheusUrl": {
                "type": "string",
                "format": "url",
                "title": "Prometheus URL"
            },
            "locked": {
                "type": "boolean",
                "title": "Locked",
                "default": False,
                "description": "Are deployments currently allowed for this configuration",
                "icon": "Lock"
            }
        },
        "required": []
    },
    "mirrorProperties": {},
    "calculationProperties": {},
    "relations": {},
    "changelogDestination": {
        "type": "WEBHOOK",
        "url": WEBHOOK_URL
    }
}

entity = {
    "identifier": "notification-service-prod",
    "title": "Notification Service Production",
    "properties": {
        "healthStatus": "Healthy",
        "cpuUtil": 25,
        "memoryUtil": 30,
        "newRelicUrl": "https://newrelic.com",
        "sentryUrl": "https://sentry.io/",
        "prometheusUrl": "https://prometheus.io",
        "locked": False
    },
    "relations": {}
}

blueprint_response = requests.post(f'{API_URL}/blueprints', headers=headers, json=blueprint)
print(blueprint_response.json())

entity_response = requests.post(f'{API_URL}/blueprints/{target_blueprint}/entities', json=entity, headers=headers)

print(entity_response.json())
Setting up a slack webhook
Head to your slack apps page and create a new app (or select one of your existing apps). Then, go to the Incoming Webhooks page and create a new webhook, specifying the target channel on your server where messages that are sent to the slack webhook will be transferred.
Copy the webhook URL, you will use it soon to set up your python FastAPI in the next step.
Setting up a webhook target
Now you're going to set up a full basic API to receive changelog events from your software catalog in Port.
Prerequisites
Please use pip to install python dependencies for the API:
pip install fastapi pysmee pydantic uvicorn slack_sdk
Setting up the API
The code for the API is available in the changelog-listener-example-api repository, you can clone it and replace the YOUR_CLIENT_ID, YOUR_CLIENT_SECRET and SLACK_WEBHOOK_URL placeholders with your Port client ID, secret and the Slack webhook URL you generated in setting up a slack webhook.
After cloning the repository, you will have the following directory structure:
.
├── actions
│   ├── __init__.py
│   └── send_message.py
├── api
│   ├── endpoints
│   │   ├── __init__.py
│   │   └── slack.py
│   ├── __init__.py
│   └── deps.py
├── core
│   ├── __init__.py
│   └── config.py
├── schemas
│   ├── __init__.py
│   └── webhook.py
└── main.py
Running the API
To run the API, open a new terminal and run the following command in the root directory of the cloned repository:
python main.py
You will see output similar to this:
INFO:     Uvicorn running on http://0.0.0.0:80 (Press CTRL+C to quit)
INFO:uvicorn.error:Uvicorn running on http://0.0.0.0:80 (Press CTRL+C to quit)
INFO:     Started reloader process [32362] using StatReload
INFO:uvicorn.error:Started reloader process [32362] using StatReload
INFO:     Started server process [32364]
INFO:uvicorn.error:Started server process [32364]
INFO:     Waiting for application startup.
INFO:uvicorn.error:Waiting for application startup.
INFO:     Application startup complete.
INFO:uvicorn.error:Application startup complete.
Directing the webhook to the API
For this step, you can follow the steps in forwarding events to localhost from the debugging webhooks locally page.
Remember to use your Smee proxy URL, and replace http://localhost:3000/webhooks with http://localhost:80/api/slack.
Watching change events in your slack channel
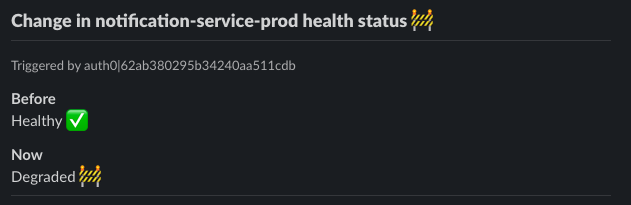
To see the result of your API, update the healthStatus field of a deployment config Entity.
When the health status of a deployment config Entity changes, you should see a new message in the slack channel you chose when you created the slack webhook:
Summary
This example shows you the power of Port's changelog capabilities.
The action taken in this guide is informative and does not trigger any changes in your infrastructure, but it can be adapted to:
- Provision more cloud resources;
- Perform a scale-up action;
- Alert the on-call;
- etc.