DORA metrics benchmark
In this guide,
we will extend the work from the DORA Metrics guide
by implementing scorecards to benchmark your services against the industry-standard DORA metrics,
as detailed in the official DORA report (2024).
This allows you to evaluate your services' performance levels and identify areas for improvement.
DORA metrics are essential for measuring the efficiency and effectiveness of your software delivery performance.
By visualizing these metrics against industry benchmarks, you can:
- Identify gaps in your software delivery process.
- Set realistic goals for improvement.
- Track progress over time.
This guide will walk you through creating a scorecard to benchmark your services' performance on the four key metrics: deployment frequency, lead time, change failure rate, and mean time to recovery.
Prerequisites
- Complete the DORA Metrics guide, ensuring you have set up the necessary blueprints, properties, and data ingestion.
Benchmarks
Before setting up the scorecard, it's crucial to understand the DORA benchmarks for each metric.
The DORA framework categorizes performance into four levels: Elite, High, Medium, and Low.
We will use these levels to represent the benchmarks on our scorecard.
- Deployment Frequency
- Lead Time for Changes
- Change Failure Rate
- Mean Time to Recovery (MTTR)
Deployment Frequency measures how often your organization deploys code to production or releases it to end-users.
Frequent deployments can indicate a streamlined and efficient development process.
- Elite: Multiple deployments per day.
- High: Between once per day and once per week.
- Medium: Between once per week and once per month.
- Low: Less than once per month.
Lead Time for Changes represents the amount of time it takes for code committed to be deployed into production.
Short lead times suggest efficient processes and quick delivery of value to customers.
- Elite: Less than one day.
- High: Between one day and one week.
- Medium: Between one week and one month.
- Low: More than one month.
Change Failure Rate is the percentage of deployments causing a failure in production that requires immediate remediation (e.g., service degradation or outage).
Lower rates indicate more stable releases and better quality control.
Teams with a higher deployment frequency may also have a higher error rate.
- Elite: Less than 5%
- High: Less than 20%
- Medium: Less than 10%
- Low: More than 20%
Mean Time to Recovery (MTTR) measures how quickly your team can restore service when a failure occurs.
Faster recovery times show effective incident response and resilience.
- Elite: Less than one hour.
- High: Less than one day.
- Medium: Less than one day.
- Low: More than one week.
By understanding these benchmarks, you can effectively assess your services' current performance levels and identify specific areas for improvement.
These benchmarks are consistent with the DORA report for 2024, but you can always adjust them based on your organization's specific needs.
Set up scorecard
We will create a scorecard that assesses each service against the DORA benchmarks for the four key metrics.
- Click on the
Buildericon in the top right corner. - Search for the Service blueprint and select it.
- Click on the
Scorecardstab. - Click on
+ New Scorecardto create a new scorecard. - Configure the scorecard with the following details:
Scorecard (click to expand)
{
 "identifier": "dora_metrics_bnhmrk",
 "title": "DORA Metrics",
 "levels": [
    {
       "color": "blue",
       "title": "Low"
    },
    {
       "color": "purple",
       "title": "Medium"
    },
    {
       "color": "turquoise",
       "title": "High"
    },
    {
       "color": "paleBlue",
       "title": "Elite"
    }
 ],
 "rules": [
    {
       "identifier": "deploy_freq_elite",
       "title": "Deployment Frequency - Elite",
       "description": "Service deploys multiple times per day.",
       "level": "Elite",
       "query": {
          "combinator": "and",
          "conditions": [
             {
                "property": "deployment_frequency",
                "operator": ">=",
                "value": 7
             }
          ]
       }
    },
    {
       "identifier": "deploy_freq_high",
       "title": "Deployment Frequency - High",
       "description": "Service deploys between once per day and once per week.",
       "level": "High",
       "query": {
          "combinator": "and",
          "conditions": [
             {
                "property": "deployment_frequency",
                "operator": ">=",
                "value": 1
             }
          ]
       }
    },
    {
       "identifier": "deploy_freq_medium",
       "title": "Deployment Frequency - Medium",
       "description": "Service deploys between once per week and once per month.",
       "level": "Medium",
       "query": {
          "combinator": "and",
          "conditions": [
             {
                "property": "deployment_frequency",
                "operator": ">=",
                "value": 0.25
             }
          ]
       }
    },
    {
       "identifier": "lead_time_elite",
       "title": "Lead Time - Elite",
       "description": "Lead time is less than one day.",
       "level": "Elite",
       "query": {
          "combinator": "and",
          "conditions": [
             {
                "property": "lead_time_for_change",
                "operator": "<",
                "value": 24
             }
          ]
       }
    },
    {
       "identifier": "lead_time_high",
       "title": "Lead Time - High",
       "description": "Lead time is less than one week.",
       "level": "High",
       "query": {
          "combinator": "and",
          "conditions": [
             {
                "property": "lead_time_for_change",
                "operator": "<",
                "value": 168
             }
          ]
       }
    },
    {
       "identifier": "lead_time_medium",
       "title": "Lead Time - Medium",
       "description": "Lead time is less than one month.",
       "level": "Medium",
       "query": {
          "combinator": "and",
          "conditions": [
             {
                "property": "lead_time_for_change",
                "operator": "<",
                "value": 720
             }
          ]
       }
    },
    {
       "identifier": "cfr_elite",
       "title": "Change Failure Rate - Elite",
       "description": "Failure rate is less than 5%.",
       "level": "Elite",
       "query": {
          "combinator": "and",
          "conditions": [
             {
                "property": "changeFailureRate",
                "operator": "<",
                "value": 5
             }
          ]
       }
    },
    {
       "identifier": "cfr_medium",
       "title": "Change Failure Rate - Medium",
       "description": "Failure rate is less than 10%.",
       "level": "Medium",
       "query": {
          "combinator": "and",
          "conditions": [
             {
                "property": "changeFailureRate",
                "operator": "<",
                "value": 10
             }
          ]
       }
    },
    {
       "identifier": "cfr_high",
       "title": "Change Failure Rate - High",
       "description": "Failure rate is less than 20%.",
       "level": "High",
       "query": {
          "combinator": "and",
          "conditions": [
             {
                "property": "changeFailureRate",
                "operator": "<",
                "value": 20
             }
          ]
       }
    },
    {
       "identifier": "mttr_elite",
       "title": "MTTR - Elite",
       "description": "Recovery time is less than one hour.",
       "level": "Elite",
       "query": {
          "combinator": "and",
          "conditions": [
             {
                "property": "mean_time_to_recovery",
                "operator": "<",
                "value": 60
             }
          ]
       }
    },
    {
       "identifier": "mttr_high",
       "title": "MTTR - High",
       "description": "Recovery time is less than one day.",
       "level": "High",
       "query": {
          "combinator": "and",
          "conditions": [
             {
                "property": "mean_time_to_recovery",
                "operator": "<",
                "value": 1440
             }
          ]
       }
    },
    {
       "identifier": "mttr_medium",
       "title": "MTTR - Medium",
       "description": "Recovery time is less than one week.",
       "level": "Medium",
       "query": {
          "combinator": "and",
          "conditions": [
             {
                "property": "mean_time_to_recovery",
                "operator": "<",
                "value": 10080
             }
          ]
       }
    }
 ]
}
- Click on
Saveto create the scorecard.
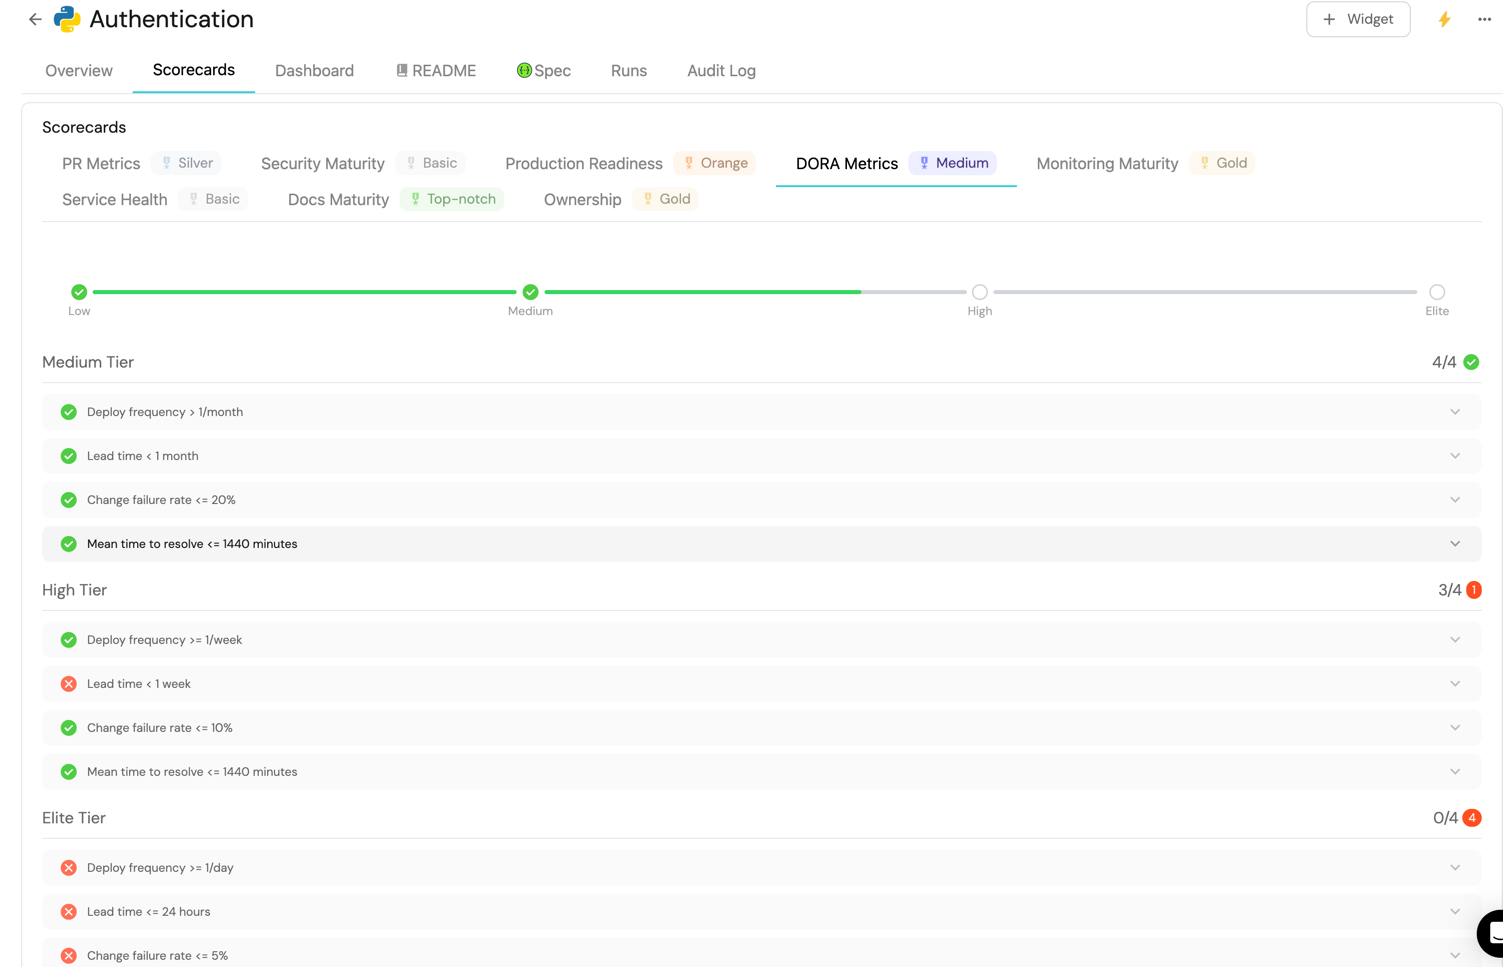
After setting up the benchmark on a service, it should look like this:

Visualisation
To make the most of your new scorecard, add it to a dashboard for easy monitoring.
If you haven't set up a dashboard for visualizing the DORA metrics, set it up here
Add scorecard widget
To add the scorecard to your dashboard:
-
Click
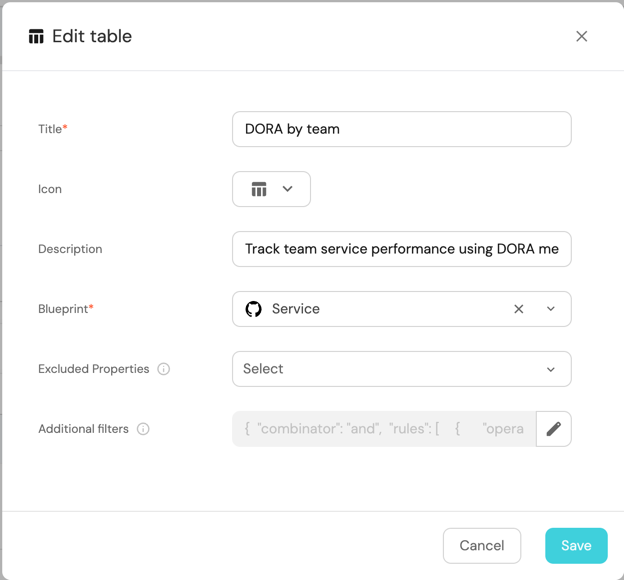
+ Widgetand select Table. -
Title the widget DORA by team.
-
Choose the Service blueprint.

-
Click Save to add the widget to the dashboard.
-
Click on the
...button in the top right corner of the table and select Customize table. -
In the top right corner of the table, click on
Manage Propertiesand add the following properties:- Title: The name of each service.
- DORA Metrics: The scorecard evaluation for each service.
- Owning Team: The team that owns the service.
-
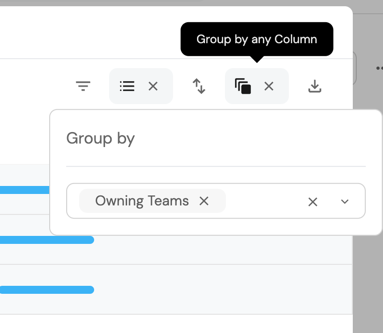
Click on the
Group by any Columnoption in the top right corner and select Owning Team.
-
Click on the save icon in the top right corner of the widget to save the customized table.
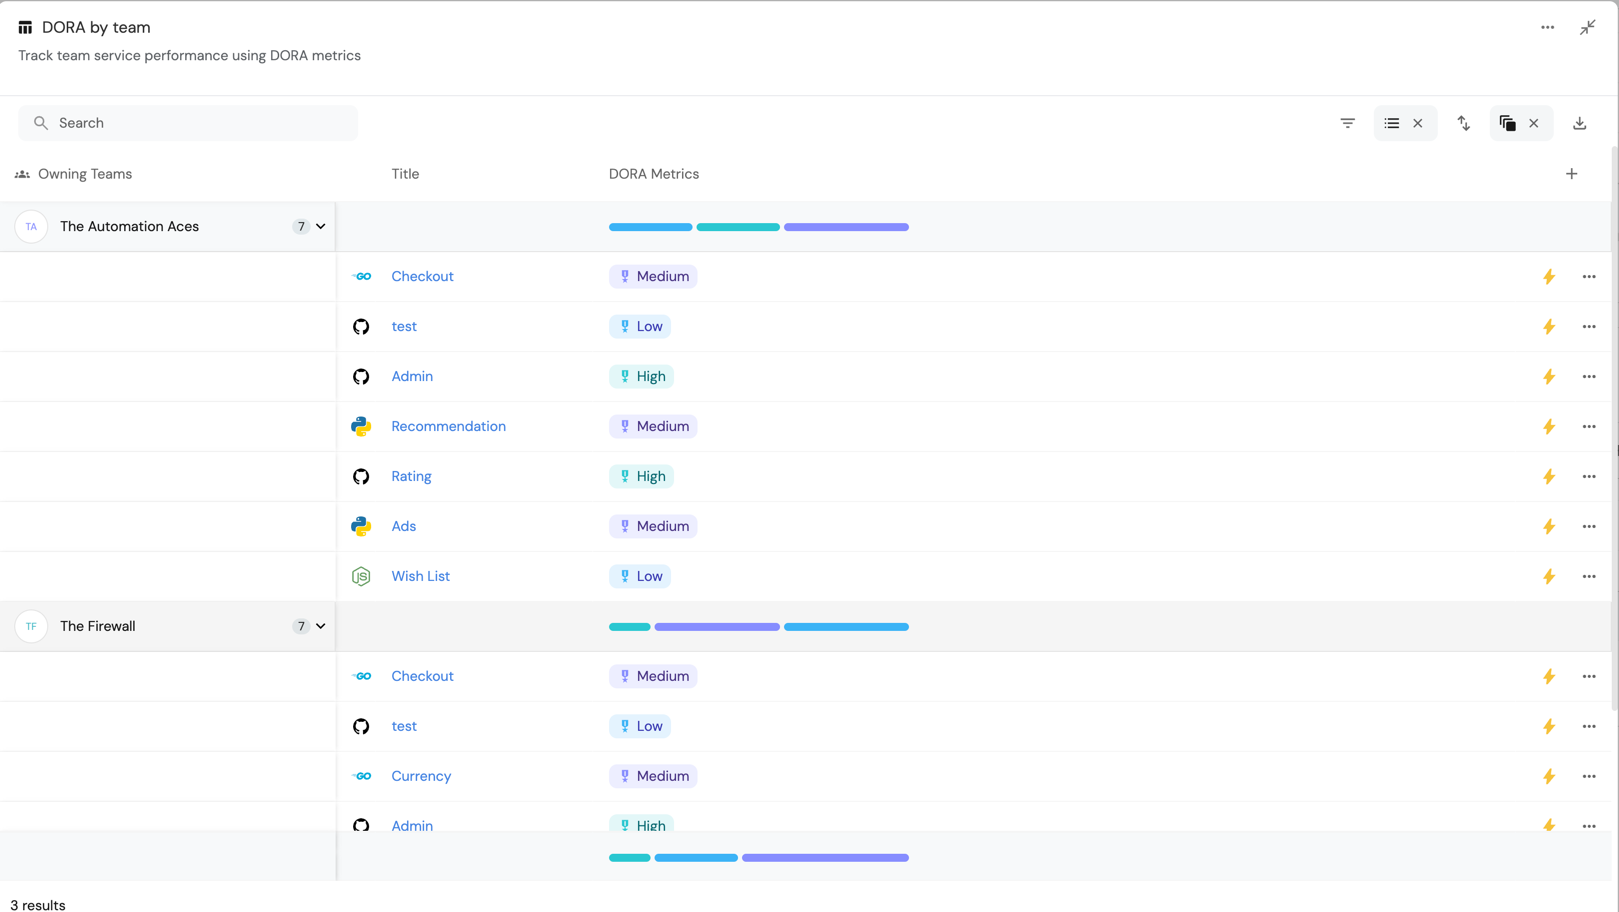
The table widget should look like this:

Congratulations! 🎉 You have successfully created a DORA Metrics Benchmark scorecard in Port.