Track DORA metrics
This guide is designed to help you implement and track DevOps Research and Assessment (DORA) metrics within your organization in Port.
DORA Metrics are a set of key performance indicators that measure the effectiveness and efficiency of your software development and delivery process. By tracking these metrics, you can identify areas for improvement and ensure that your team is delivering high-quality software efficiently. This guide will cover the four key metrics: deployment frequency, lead time, change failure rate, and mean time to recovery.
Prerequisites
- Complete the Port onboarding process.
- Access to a repository (GitHub, GitLab, or Azure Repos) that is connected to Port via the onboarding process.
- While this guide demonstrates implementations using GitHub, GitLab, and Azure Repos, other Git providers can be used as well.
- Optional for advanced strategies: If you're using workflows or pipelines, ensure they are configured for deployment tracking by following the relevant setup guides, such as CI/CD integrations or your platform-specific tools.
Tracking deployments
In this section, we will cover how to track your team's deployments. Deployments refer to releasing new or updated code into various environments, such as Production, Staging, or Testing. Tracking deployments helps you understand how efficiently your team ships features and monitors release stability.
Deployments contribute to three key DORA metrics:
- Deployment Frequency: How often changes are deployed to production or other environments.
- Change Failure Rate: The percentage of deployments that fail and require intervention, rollback, or generate issues.
- Lead Time for Changes: The time it takes from code commit to deployment into production.
To track the necessary data for these metrics, we will create a Deployment Blueprint with properties that capture the essential information for each deployment.
Data model setup
- Navigate to your Port Builder page.
- Click the
+ Blueprintbutton to create a new blueprint. - Name it
Deploymentand add the schema below:
Deployment blueprint (click to expand)
{
  "identifier": "deployment",
  "title": "Deployment",
  "icon": "Rocket",
  "schema": {
    "properties": {
      "createdAt": {
        "title": "Deployment Time",
        "type": "string",
        "format": "date-time",
        "description": "The timestamp when the deployment was triggered."
      },
      "environment": {
        "title": "Environment",
        "type": "string",
        "enum": [
          "Production",
          "Staging",
          "Testing"
        ],
        "description": "The environment where the deployment occurred."
      },
      "deploymentStatus": {
        "title": "Deployment Status",
        "type": "string",
        "enum": [
          "Success",
          "Failed"
        ],
        "description": "Indicates whether the deployment was successful or failed."
      }
    },
    "required": []
  },
  "mirrorProperties": {
    "leadTimeHours": {
      "title": "Lead Time (Hours)",
      "path": "pullRequest.leadTimeHours"
    }
  },
  "calculationProperties": {},
  "aggregationProperties": {},
  "relations": {
    "service": {
      "title": "Service",
      "target": "service",
      "required": false,
      "many": false
    },
    "pullRequest": {
      "title": "Pull Request",
      "target": "githubPullRequest",
      "required": false,
      "many": false
    }
  }
}
If you do not have the lead time configured, you can follow the integration guide for your Git provider to add this property:
- GitHub: GitHub integration guide
- GitLab: GitLab integration guide
- Azure Repos: Azure Repos integration guide
- Go to the Builder in your Port portal.
- Click on "+ Blueprint" to create a new blueprint.
- Click on the
{...}button in the top right corner, and choose "Edit JSON". - Add this JSON schema to define the properties and relations needed for your blueprint.
By following these steps, you can paste and manage the JSON schema required to track DORA metrics in Port.
Tracking strategies
Below are the main ways you can track deployments directly within Port:
- PR/MR Merge
- Workflow/Job
- CI/CD Pipelines
- Releases/Tags
- Custom API
One of the ways to track deployments is by monitoring when pull requests (PRs)/ merge request (MRs) are merged into a branch, typically the main/master branch. This is the recommended approach for tracking deployments and calculating lead time.
The lead time for these merges is calculated as the difference between when the PR/MR was created and when it was merged.
- GitHub
- GitLab
- Azure Repos
Below is a demonstration of how deployment tracking can be implemented using the PR merge strategy.
Example:
- When a PR is merged, a deployment entity is created in Port to represent the deployment that took place.
- The lead time for that PR is calculated and added to the deployment as part of the blueprint.
Here’s how you can implement this:
-
Add Pull Request blueprint, sample can be found here.
-
Add the configuration below to the data sources page in your Port portal, and select your GitHub integration:
Deployment config (click to expand)
 - kind: pull-request
   selector:
    query: .base.ref == 'main' and .state == 'closed'  # Track PRs merged into the main branch
   port:
     entity:
       mappings:
         identifier: .head.repo.name + '-' + (.id|tostring)
         title: .head.repo.name + " Deployment"
         blueprint: '"deployment"'
         properties:
          environment: '"Production"'  # Hardcoded value
          createdAt: .merged_at
          deploymentStatus: '"Success"' # Hardcoded value
       relations:
         pullRequest: .head.repo.name + (.id|tostring)
         service: .head.repo.name
Below is a demonstration of how deployment tracking can be implemented using the MR merge strategy:
Example:
- When a MR is merged, a deployment entity is created in Port to represent the deployment that took place.
- The lead time for that MR is calculated and added to the deployment as part of the blueprint.
Here’s how you can implement this:
-
Add Merge Request blueprint, sample can be found here.
-
Add the configuration below to the data sources page in your Port portal, and select your GitLab integration:
Deployment config (click to expand)
 - kind: merge-request
   selector:
     query: .target_branch == 'main' and .state == 'merged' # Track MRs merged into the main branch
   port:
     entity:
       mappings:
         identifier: .source_branch + '-' + (.id|tostring)
         title: .source_branch + " Deployment"
         blueprint: '"deployment"'
         properties:
           environment: '"Production"' # Hardcoded value
           createdAt: .merged_at
           deploymentStatus: '"Success"' # Hardcoded value
         relations:
           service: .references.full | gsub("!.+"; "")
           mergeRequest: .id | tostring
if you don't have a merge request relationship with the deployment blueprint add this sample json in relations of the deployment blueprint to create that relationship
    "mergeRequest": {
      "title": "Merge Request",
      "target": "gitlabMergeRequest",
      "required": false,
      "many": false
    }
Below is a demonstration of how deployment tracking can be implemented using the Azure DevOps PR merge strategy:
Example:
- When a PR is merged, a deployment entity is created in Port to represent the deployment that took place.
- The lead time for that PR is calculated and added to the deployment as part of the blueprint.
Here’s how you can implement this:
-
Add Pull Request blueprint, sample can be found here.
-
Add the configuration below to the data sources page in your Port portal, and select your Azure Devops integration:
Deployment config (click to expand)
 - kind: pull-request
   selector:
     query: .targetRefName == "refs/heads/main" and .status == "completed"   # Track PRs merged into the main branch
   port:
     entity:
       mappings:
         identifier: .repository.name + (.pullRequestId| tostring)
         blueprint: '"deployment"'
         title: .repository.name + " Deployment"
         properties:
           createdAt: .closedDate
           deploymentStatus: '"Success"' # Hardcoded value
           environment: '"Production"' # Hardcoded value
         relations:
           pullRequest: .repository.name + '-' + (.pullRequestId|tostring)
           service: .repository.name
The value for deploymentStatus is hardcoded to Success to treat all deployments as successful,
and the environment is hardcoded to Production for the main branch in this example.
You can modify these values based on your requirements.
Track deployments by monitoring workflow runs in your pipeline. This setup captures all workflow runs from the main branch and maps them to deployment entities. The deployment status is set dynamically based on whether the workflow run concluded successfully or failed.
Below is a demonstration of how deployment tracking can be implemented using workflow/job.
- GitHub
- GitLab
Below is how the deployment tracking can be done in GitHub using workflow runs:
Example:
- When a GitHub Actions workflow runs on the main branch, a deployment entity is created in Port to represent the deployment.
- The deployment status is dynamically set based on the workflow run's conclusion.
Here’s how you can implement this:
- Add the configuration below to the data sources page in your Port portal, and select your GitHub integration:
Deployment via Workflow Runs (click to expand)
- kind: workflow-run
  selector:
    query: >
      (.head_branch == "main") and
      (.name | test("deploy|CD"; "i"))   # Track workflows with deploy or CD in the name
  port:
    entity:
      mappings:
        identifier: .head_repository.name + '-' + (.run_number|tostring)
        title: .head_repository.name + " Deployment via workflow"
        blueprint: '"deployment"'
        properties:
          environment: '"Production"'
          createdAt: .created_at
          deploymentStatus: (.conclusion | ascii_upcase[0:1] + .[1:])
        relations:
          service: .head_repository.name
Below is how the deployment tracking can be done in GitLab using pipeline jobs:
Example:
- When a GitLab CI/CD pipeline runs on the main branch, a deployment entity is created in Port.
- The deployment status is dynamically set based on the pipeline's status.
Here’s how you can implement this:
- Add the configuration below to the data sources page in your Port portal, and select your GitLab integration:
Deployment via Pipeline Runs (click to expand)
  - kind: pipeline
    selector:
      query: '(.ref == "main") and (.name | test("deploy|CD"; "i"))' # Track pipelines with deploy or CD in the name
    port:
      entity:
        mappings:
          identifier: >-
            "deployment-" + (.id | tostring)
          title: .project.name + " Deployment via pipeline"
          blueprint: '"deployment"'
          properties:
            environment: '"Production"'
            createdAt: .created_at
            deploymentStatus: (.status | ascii_upcase[0:1] + .[1:])
          relations:
            service: .__project.path_with_namespace | gsub(" "; "")
You can use regex to track only workflows/pipeline related to deployments (e.g., workflows/pipeline containing the word "deploy" or "CD"). The environment is automatically determined based on the branch, where the main branch corresponds to Production.
This approach can also be implemented for other CI/CD tools such as Jenkins, CircleCI. Each tool allows you to monitor workflows or pipeline runs and map them into Port as deployment entities, ensuring consistency across multiple platforms.
By following a similar pattern for other tools, you will be able to capture deployment metadata, dynamically set the deployment status, and represent all your deployment activities in a unified way in Port.
CI/CD pipelines, such as those run by Jenkins, provide a robust way to track deployments. Jenkins, in particular, allows you to create and update entities in Port dynamically using Port's API as part of the pipeline execution.
Examples:
Port supports tracking deployments from various CI/CD tools by monitoring pipelines and reporting the deployment status to Port. Here are examples for some commonly used CI/CD tools:
- Jenkins
- Octopus Deploy
- CircleCI
- Azure Pipelines
- Codefresh
- Gitlab
Jenkins provides a robust way to track deployments by dynamically reporting build statuses to Port using Port's API. find more here
Add this example to your Jenkins pipeline to report deployments to Port:
Jenkins Pipeline Example (click to expand)
pipeline {
  agent any
  environment {
    API_URL = "https://api.getport.io"
  }
  stages {
    stage('Report Deployment to Port') {
      steps {
        withCredentials([
                string(credentialsId: 'port-client-id', variable: 'PORT_CLIENT_ID'),
                string(credentialsId: 'port-client-secret', variable: 'PORT_CLIENT_SECRET')
        ]) {
          script {
            def auth_body = """
              {
                "clientId": "${PORT_CLIENT_ID}",
                "clientSecret": "${PORT_CLIENT_SECRET}"
              }
            """
            def token_response = httpRequest contentType: 'APPLICATION_JSON',
                    httpMode: 'POST',
                    requestBody: auth_body,
                    url: "${API_URL}/v1/auth/access_token"

            def token = new groovy.json.JsonSlurperClassic().parseText(token_response.content).accessToken

            def entity_body = """
              {
                "identifier": "${env.JOB_NAME}-${env.BUILD_NUMBER}",
                "title": "Deployment for ${env.JOB_NAME}",
                "properties": {
                  "environment": "Production",
                  "createdAt": "${env.BUILD_TIMESTAMP}",
                  "deploymentStatus": "${env.BUILD_STATUS == 'SUCCESS' ? 'Success' : 'Failed'}"
                },
                "relations": {
                  "service": {
                    "combinator": "and",
                    "rules": [
                      {
                        "property": "$title",
                        "operator": "=",
                        "value": "${env.JOB_NAME}"
                      }
                    ]
                  }
                }
              }
            """

            httpRequest contentType: "APPLICATION_JSON",
                    httpMode: "POST",
                    url: "${API_URL}/v1/blueprints/deployment/entities?upsert=true&merge=true",
                    requestBody: entity_body,
                    customHeaders: [
                            [name: 'Authorization', value: "Bearer ${token}"]
                    ]
          }
        }
      }
    }
  }
}
Octopus can be used to track deployments by reporting to Port using custom API calls after deployments are triggered. Find more here
Add this example to your Octopus script to report deployments to Port:
Octopus Deploy Example (click to expand)
# Octopus script example for deployment tracking in Port
steps:
  - run: |
      curl -X POST \
      -H "Authorization: Bearer <YOUR_TOKEN>" \
      -H "Content-Type: application/json" \
      -d '{
        "identifier": "octopus-{{build_id}}",
        "title": "Deployment for Octopus {{build_id}}",
        "properties": {
          "environment": "Production",
          "createdAt": "{{timestamp}}",
          "deploymentStatus": "Success"
        },
        "relations": {
          "service": {
            "combinator": "and",
            "rules": [
              {
                "property": "$title",
                "operator": "=",
                "value": "{{project.name}}"
              }
            ]
          }
        }
      }' \
      https://api.getport.io/v1/blueprints/deployment/entities?upsert=true&merge=true
Track deployments in CircleCI by reporting pipeline runs to Port using a configuration similar to Jenkins. Find more here
Add this example to your CircleCI pipeline to report deployments to Port:
CircleCI Pipeline Example (click to expand)
      version: 2.1

      jobs:
        deploy:
          docker:
            - image: circleci/node:latest
          steps:
            - run:
                name: "Notify Port of deployment"
                command: |
                  curl -X POST https://api.getport.io/v1/blueprints/deployment/entities?upsert=true&merge=true \
                  -H "Authorization: Bearer $PORT_API_TOKEN" \
                  -d '{
                    "identifier": "circleci-{{build_number}}",
                    "title": "Deployment for CircleCI {{build_number}}",
                    "properties": {
                      "environment": "Production",
                      "createdAt": "{{timestamp}}",
                      "deploymentStatus": "Success"
                    },
                    "relations": {
                      "service": {
                        "combinator": "and",
                        "rules": [
                          {
                            "property": "$title",
                            "operator": "=",
                            "value": "{{.repository.name}}"
                          }
                        ]
                      }
                    }
                  }'
Azure Pipelines can track deployments by integrating with Port's API in a similar manner. find more here
Add this example to your Azure Pipelines script to report deployments to Port:
Azure Pipelines Example (click to expand)
trigger:
- master

jobs:
- job: DeployToProd
  steps:
  - script: |
      curl -X POST \
      -H "Authorization: Bearer $PORT_API_TOKEN" \
      -H "Content-Type: application/json" \
      -d '{
        "identifier": "azure-$(Build.BuildId)",
        "title": "Deployment for Azure $(Build.BuildId)",
        "properties": {
          "environment": "Production",
          "createdAt": "$(Build.QueuedTime)",
          "deploymentStatus": "Success"
        },
        "relations": {
          "service": {
            "combinator": "and",
            "rules": [
              {
                "property": "$title",
                "operator": "=",
                "value": "$(Build.Repository.Name)"
              }
            ]
          }
        }
      }' \
      https://api.getport.io/v1/blueprints/deployment/entities?upsert=true&merge=true
Track deployments in Codefresh by integrating Port's API with your pipeline configurations. find more here
Add this example to your Codefresh pipeline to report deployments to Port:
Codefresh Pipeline Example (click to expand)
version: '1.0'
steps:
  ReportToPort:
    title: Reporting to Port
    type: freestyle
    image: curlimages/curl
    commands:
      - curl -X POST https://api.getport.io/v1/blueprints/deployment/entities?upsert=true&merge=true \
        -H "Authorization: Bearer $PORT_API_TOKEN" \
        -d '{
          "identifier": "codefresh-{{CF_BUILD_ID}}",
          "title": "Deployment for Codefresh {{CF_BUILD_ID}}",
          "properties": {
            "environment": "Production",
            "createdAt": "{{CF_BUILD_TIMESTAMP}}",
            "deploymentStatus": "Success"
          },
          "relations": {
          "service": {
            "combinator": "and",
            "rules": [
              {
                "property": "$title",
                "operator": "=",
                "value": "{{repository.name}}"
              }
            ]
          }
        }
        }'
Track GitLab pipeline deployments using a similar approach to report data to Port. find more here
Add this example to your GitLab pipeline to report deployments to Port:
GitLab Pipeline Example (click to expand)
stages:
  - deploy

deploy:
  stage: deploy
  script:
    - curl -X POST https://api.getport.io/v1/blueprints/deployment/entities?upsert=true&merge=true \
      -H "Authorization: Bearer $PORT_API_TOKEN" \
      -d '{
        "identifier": "gitlab-{{CI_JOB_ID}}",
        "title": "Deployment for GitLab {{CI_JOB_ID}}",
        "properties": {
          "environment": "Production",
          "createdAt": "{{CI_JOB_TIMESTAMP}}",
          "deploymentStatus": "Success"
        },
        "relations": {
         "service": {
           "combinator": "and",
           "rules": [
             {
               "property": "$title",
               "operator": "=",
               "value": "{{.project.name}}"
             }
           ]
         }
       }
      }'
we use the search relation entity to map the deployment to the correct service based on the service's $title.
To learn more about using search relations,
see our documentation on Mapping Relations
Using Search Queries.
GitHub deployments can be tracked by mapping repository releases and tags to deployment entities in Port. These repositories can hold critical information related to service versions, commits, and releases.
Here’s how you can implement this:
- Add the configuration below to the data sources page in your Port portal, and select your GitHub integration.
Releases and Tags config (click to expand)
- kind: release
    selector:
      query: (.target_commitish == "main") and (.name | test("Production"; "i"))  # Checking if the name contains "Production" (case-insensitive)
    port:
      entity:
        mappings:
          identifier: .release.name + '-' + .release.tag_name
          title: .release.name + " Deployment on release"
          blueprint: '"deployment"'
          properties:
            environment: '"Production"'
            createdAt: .release.created_at
            deploymentStatus: '"Success"'
          relations:
            service: .repo.name
This configuration maps the repository, release, and tag information to deployment entities in Port. You can find more details about setting up GitHub integrations for repositories, releases, and tags here. You can modify the query to match your naming conventions and requirements. this example tracks release with Production in the name.
Unlike GitHub, GitLab and Azure DevOps do not support traditional releases and tags in the same way. In these platforms, deployments are better tracked through CI/CD pipelines.
If your tool or workflow is not natively supported, you can create custom integrations by directly interacting with Port’s API. This method allows you to track deployments from any system that can make HTTP API calls.
Here’s how you can use the API to create a deployment entity in Port:
Custom API Example (click to expand)
curl -X POST https://api.getport.io/v1/blueprints/deployment/entities?upsert=true&merge=true \
-H "Authorization: Bearer $YOUR_PORT_API_TOKEN" \
-H "Content-Type: application/json" \
-d '{
  "identifier": "custom-deployment-1234",
  "title": "Custom Deployment for ID 1234",
  "properties": {
    "environment": "Production",
    "createdAt": "2024-09-01T12:00:00Z",
    "deploymentStatus": "Success"
  },
  "relations": {
    "service": {
      "combinator": "and",
      "rules": [
        {
          "property": "$title",
          "operator": "=",
          "value": "Custom-Service-Name"
        }
      ]
    }
  }
}'
we use the search relation entity to map the deployment to the correct service based on the service's $title.
To learn more about using search relations,
see our documentation on Mapping Relations
Using Search Queries.
You can change the query to match the naming convention in your organization
and remember to replace $YOUR_PORT_API_TOKEN with your actual API token from port
By using this approach, you can ensure any deployment system is integrated into Port, giving you full flexibility across all your deployment workflows.
Monorepo Tracking
By using custom integrations, you can effectively track services or components within a monorepo.
Here’s how you can do this:
-
Mapping Service with Monorepo: You can track the individual services or features within a monorepo by adjusting the mappings associated with the file kind. Each microservice or feature should have distinct properties such as
name,deployment status, anddependencies. -
Ingest Data via Port API: Use Port's API to track changes, deployments, or pull request merges for each service individually. By using selectors, you can map specific parts of the monorepo (e.g., specific directories) to corresponding services.
The following YAML example demonstrates how to track multiple services (e.g., service-A, service-B) within a monorepo:
resources:
  - kind: repository
    selector:
      query: ".name == 'monorepo' && (.path | startswith('service-A/') || .path | startswith('service-B/'))"
    port:
      entity:
        mappings:
          identifier: .path
          title: .path | split('/')[0]
          blueprint: '"service"'
          properties:
            url: .html_url
            defaultBranch: .default_branch
In this setup:
- The
querychecks if the repository is the monorepo and if the file path starts with eitherservice-A/orservice-B/. - The
identifieris mapped to the path, which uniquely identifies the service. - The
titleis derived from the service name in the file path.
By this method, individual services within a monorepo are mapped to Port blueprints.
Custom integrations provide flexibility in mapping and tracking each service or microservice within a monorepo. With Port’s API, you can track deployments and updates for each component separately, giving you granular control over monitoring and managing services in a monorepo.
Tracking incidents
Incidents are essential for tracking key DORA metrics, including Change Failure Rate (CFR) and Mean Time to Recovery (MTTR). Effective incident tracking reveals insights into how frequently deployments fail and how quickly teams can resolve issues. This section outlines how to:
- Use incidents to calculate CFR and MTTR.
- Link incidents to services to track the impact of failures.
- Aggregate metrics across incidents for better monitoring.
Data model setup
Ensure that your PagerDuty incident blueprint is properly configured to map incidents to the correct services(gitHub). This includes defining the appropriate properties and relations for incidents.Follow this PagerDuty Incident Blueprint Setup Link to implement.
-
Add the following properties to capture incident resolution time and recovery time:
Additional properties for PagerDuty Incident Blueprint (click to expand)
 "resolvedAt": {
   "title": "Incident Resolution Time",
   "type": "string",
   "format": "date-time",
   "description": "The timestamp when the incident was resolved"
 },
 "recoveryTime": {
   "title": "Time to Recovery",
   "type": "number",
   "description": "The time (in minutes) between the incident being triggered and resolved"
} -
Add this mapping config to pagerduty incident data source:
Incident mapping config for resolvedAt and recoveryTime (click to expand)
   resolvedAt: .resolved_at
   recoveryTime: >-
      (.created_at as $createdAt | .resolved_at as $resolvedAt |
      if $resolvedAt == null then null else
      ( ($resolvedAt | strptime("%Y-%m-%dT%H:%M:%SZ") | mktime) -
        ($createdAt | strptime("%Y-%m-%dT%H:%M:%SZ") | mktime) ) / 60 end) # Time in minutes and divide by 3600 if you want it calculated in hours
Syncing incidents with PagerDuty and other tools
To sync incidents from PagerDuty, follow the steps in the PagerDuty guide. The guide provides detailed steps for setting up integrations to track incidents related to deployments.
For other incident management tools, follow these respective guides:
Relating Incident to services
Add this relationship to the Incident blueprint to link incidents to GitHub or Gitlab or Azure DevOps repository (service):
- GitHub
- GitLab
- Azure DevOps
This section covers how to map incidents to GitHub repositories using the gitHubRepository relation.
{
  "gitHubRepository": {
    "title": "GitHub Service",
    "target": "service",
    "required": false,
    "many": false
  }
}
This section covers how to map incidents to GitLab repositories using the gitLabRepository relation.
{
  "gitLabRepository": {
    "title": "GitLab Service",
    "target": "service",
    "required": false,
    "many": false
  }
}
This section covers how to map incidents to Azure DevOps repositories using the azureRepository relation.
{
  "azureRepository": {
    "title": "Azure DevOps Service",
    "target": "service",
    "required": false,
    "many": false
  }
}
Update the mapping config to pagerduty incident data source:
Incident mapping config (click to expand)
   - kind: incidents
     selector:
        query: 'true'
        ...: # Add other selectors as needed
     port:
        entity:
           mappings:
              identifier: .id | tostring
              title: .title
              blueprint: '"pagerdutyIncident"'
              properties:
                 status: .status
                 url: .self
                 resolvedAt: .resolved_at
                 recoveryTime: >-
                    (.created_at as $createdAt | .resolved_at as $resolvedAt |
                    if $resolvedAt == null then null else
                    ( ($resolvedAt | strptime("%Y-%m-%dT%H:%M:%SZ") | mktime) -
                      ($createdAt | strptime("%Y-%m-%dT%H:%M:%SZ") | mktime) ) / 60 end)
                 ... # Add other properties as needed
              relations:
                 pagerdutyService: .service.id
                 # Add this relation to map the incident to the correct service
                 gitHubRepository:
                    combinator: '"and"'
                    rules:
                       - property: '"$title"'
                         operator: '"="'
                         value: .service.summary
we use the search relation entity to map the pagerdutyIncident blueprint to the correct service based on the service's $title and the pagerduty incident service.summary.
We have assumed that the service name/title exists in the service.summary property of the incident, but you can modify this query to map based on other properties that better match your setup
To learn more about using search relations, see our documentation on Mapping Relations
Using Search Queries.
Metrics
We will now aggregate the DORA metrics at the service level, allowing us to track metrics such as Deployment Frequency, Change Lead Time, Change Failure Rate (CFR), and Mean Time to Recovery (MTTR) for each service.
If you want to track these metrics at higher levels, such as team or domain, makes sure the appropriate team or domain blueprints exist, and that they have relationships defined with the service blueprint. Then, you can apply the aggregation properties for these higher hierarchies, similar to how we are doing for the service blueprint below.
Aggregation
The metrics in this guide are aggregated monthly. However, you can easily switch the timeframes to weekly, hourly, etc., based on your requirements.
Before proceeding, follow these steps to add the aggregation and calculation properties to the Service Blueprint:
- Go to the Builder in your Port portal.
- Locate and select your Service blueprint.
- Click the
{...}button in the top right corner, and choose Edit JSON. - Insert the respective aggregation or calculation properties under the
aggregationPropertiesorcalculationPropertiessection in the Service blueprint's JSON schema. - Save your changes to apply the new aggregation configuration.
- Deployment Frequency
- Change Lead Time
- Change Failure Rate
- Mean Time to Recovery
Add this aggregation property to calculate deployment frequency:
Deployment Frequency (click to expand)
"deployment_frequency": {
   "title": "Monthly Deployment Frequency",
   "icon": "DeploymentIcon",
   "type": "number",
   "target": "deployment",
   "query": {
      "combinator": "and",
      "rules": [
         {
            "property": "deploymentStatus",
            "operator": "=",
            "value": "Success"
         }
      ]
   },
   "calculationSpec": {
      "func": "average",
      "averageOf": "month",
      "measureTimeBy": "$createdAt",
      "calculationBy": "entities"
   }
}
Add this aggregation property to calculate the lead time for changes:
Lead Time for Change (click to expand)
"lead_time_for_change": {
   "title": "Lead Time for Change",
   "icon": "DefaultProperty",
   "type": "number",
   "target": "githubPullRequest",
   "query": {
     "combinator": "and",
     "rules": [
       {
         "property": "status",
         "operator": "=",
         "value": "merged"
       }
     ]
   },
   "calculationSpec": {
     "func": "average",
     "averageOf": "total",
     "property": "leadTimeHours",
     "measureTimeBy": "$createdAt",
     "calculationBy": "property"
   }
 }
Ensure that the target property is set to the correct Git provider (e.g., githubPullRequest for GitHub, gitlabMergeRequest for GitLab and azureDevOpsPullRequest for Azure DevOps).
You can add additional rules to the query to filter for the last month, last week, or other timeframes as needed.
To filter for data from the last month, use this JSON snippet:
{
    "operator": "between",
    "property": "resolvedAt",
    "value": {
      "preset": "lastMonth"
    }
}
Add the following to the aggregated property in service:
CFR aggregation property (click to expand)
  "total_incidents":{
      "title": "Total Incidents",
      "type": "number",
      "target": "pagerdutyIncident",
      "calculationSpec": {
        "calculationBy": "entities",
        "func": "count",
        "averageOf": "month",
        "measureTimeBy": "$createdAt"
      }
  },
   "total_deployments": {
      "title": "Total Monthly Deployment Frequency",
      "type": "number",
      "target": "deployment",
      "query": {
         "combinator": "and",
         "rules": [
            {
               "property": "deploymentStatus",
               "operator": "=",
               "value": "Success"
            }
         ]
      },
      "calculationSpec": {
         "func": "average",
         "averageOf": "month",
         "measureTimeBy": "$createdAt",
         "calculationBy": "entities"
      }
   }
Add this calculation property to calculate the cfr from the aggregated properties:
CFR calculation property (click to expand)
      "changeFailureRate": {
        "title": "Change Failure Rate",
        "calculation": "(.properties.total_incidents / .properties.total_deployments) * 100",
        "type": "number"
      }
Add this aggregation property to calculate the MTTR:
Mean Time to Recovery (click to expand)
   "mean_time_to_recovery": {
      "title": "Mean Time to Recovery",
      "icon": "DefaultProperty",
      "type": "number",
      "target": "pagerdutyIncident",
      "calculationSpec": {
        "func": "average",
        "averageOf": "total",
        "property": "recoveryTime",
        "measureTimeBy": "resolvedAt",
        "calculationBy": "property"
      }
    }
You can add additional rules to the query to filter for the last month, last week, or other timeframes as needed.
To filter for data from the last month, use this JSON snippet:
{
    "operator": "between",
    "property": "resolvedAt",
    "value": {
      "preset": "lastMonth"
    }
}
At this point, you can already visit each service to view the aggregated DORA metrics. However, note that the aggregation data will only be calculated based on newly ingested data moving forward. click here for more details on aggregation properties.
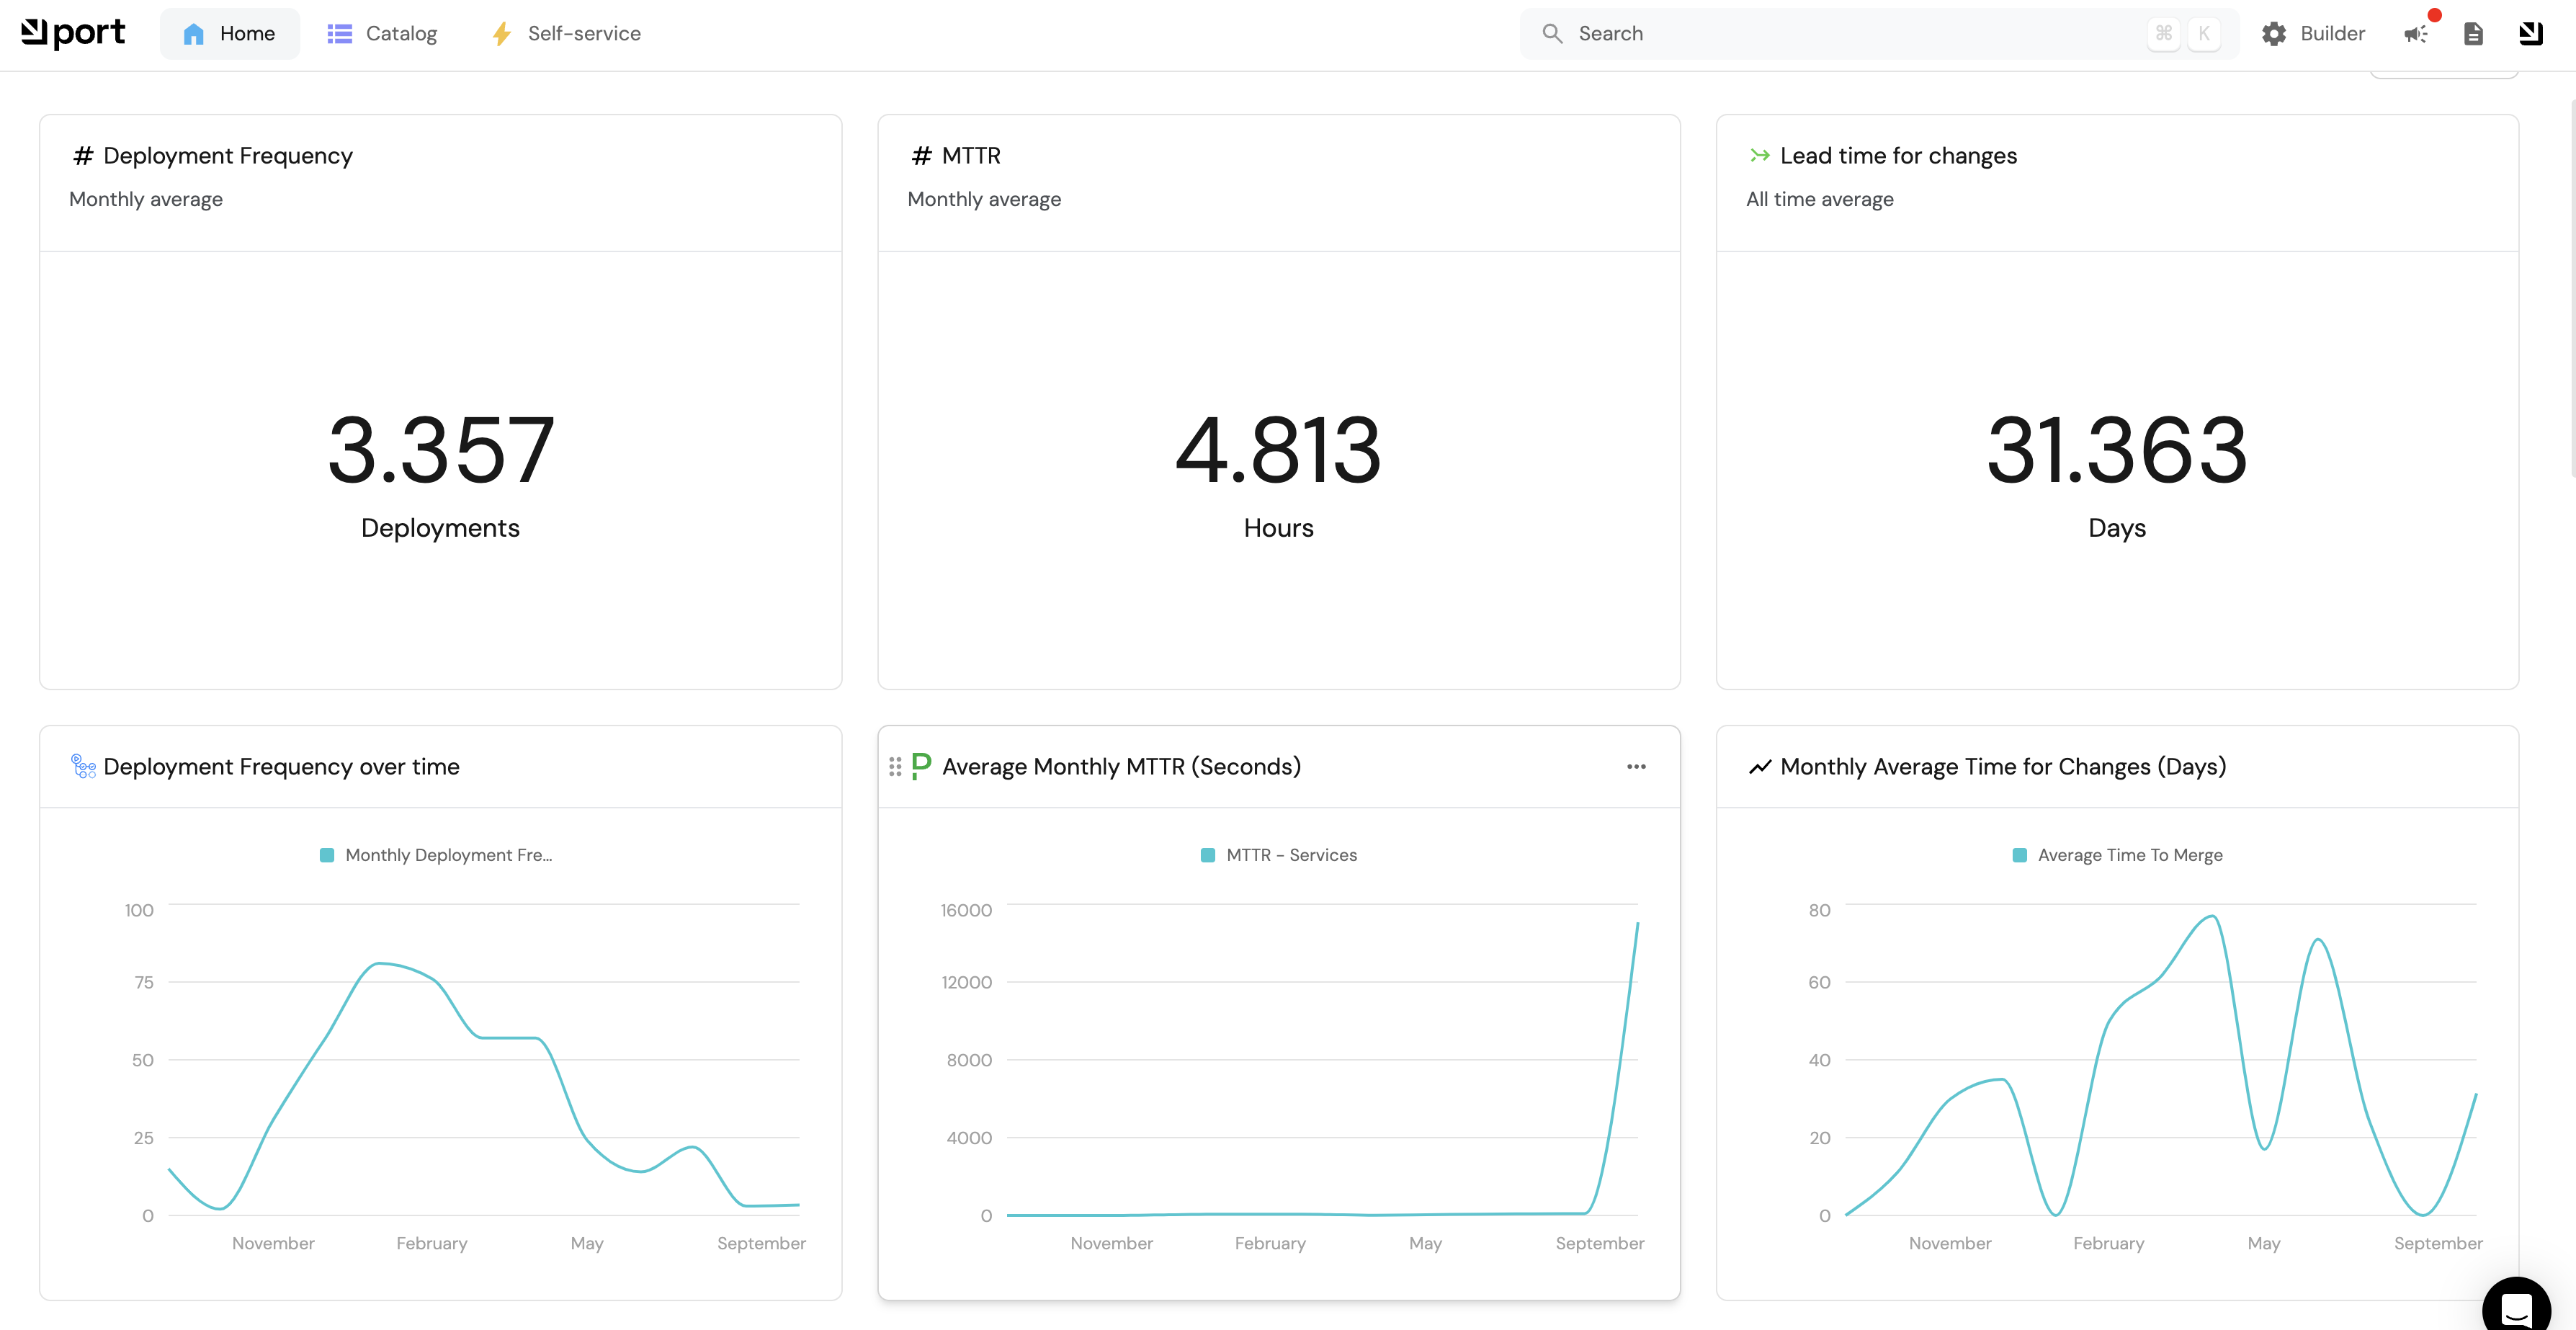
Visualization
By leveraging Port's Dashboards, you can create custom dashboards to track the metrics and monitor your team's performance over time.
Dashboard setup
- Go to your software catalog.
- Click on the
+ Newbutton in the left sidebar. - Select New dashboard.
- Name the dashboard (e.g., DORA Metrics), choose an icon if desired, and click
Create.
This will create a new empty dashboard. Let's get ready-to-add widgets
Adding widgets
Setup Deployment Frequency Widget
-
Click
+ Widgetand select Number Chart. -
Title:
Deployment Frequency - Monthly, (add the rocket icon). -
Select
Display single propertyand choose Service as the Blueprint. -
Select an
Entityand chooseMonthly Deployment Frequencyas the Property.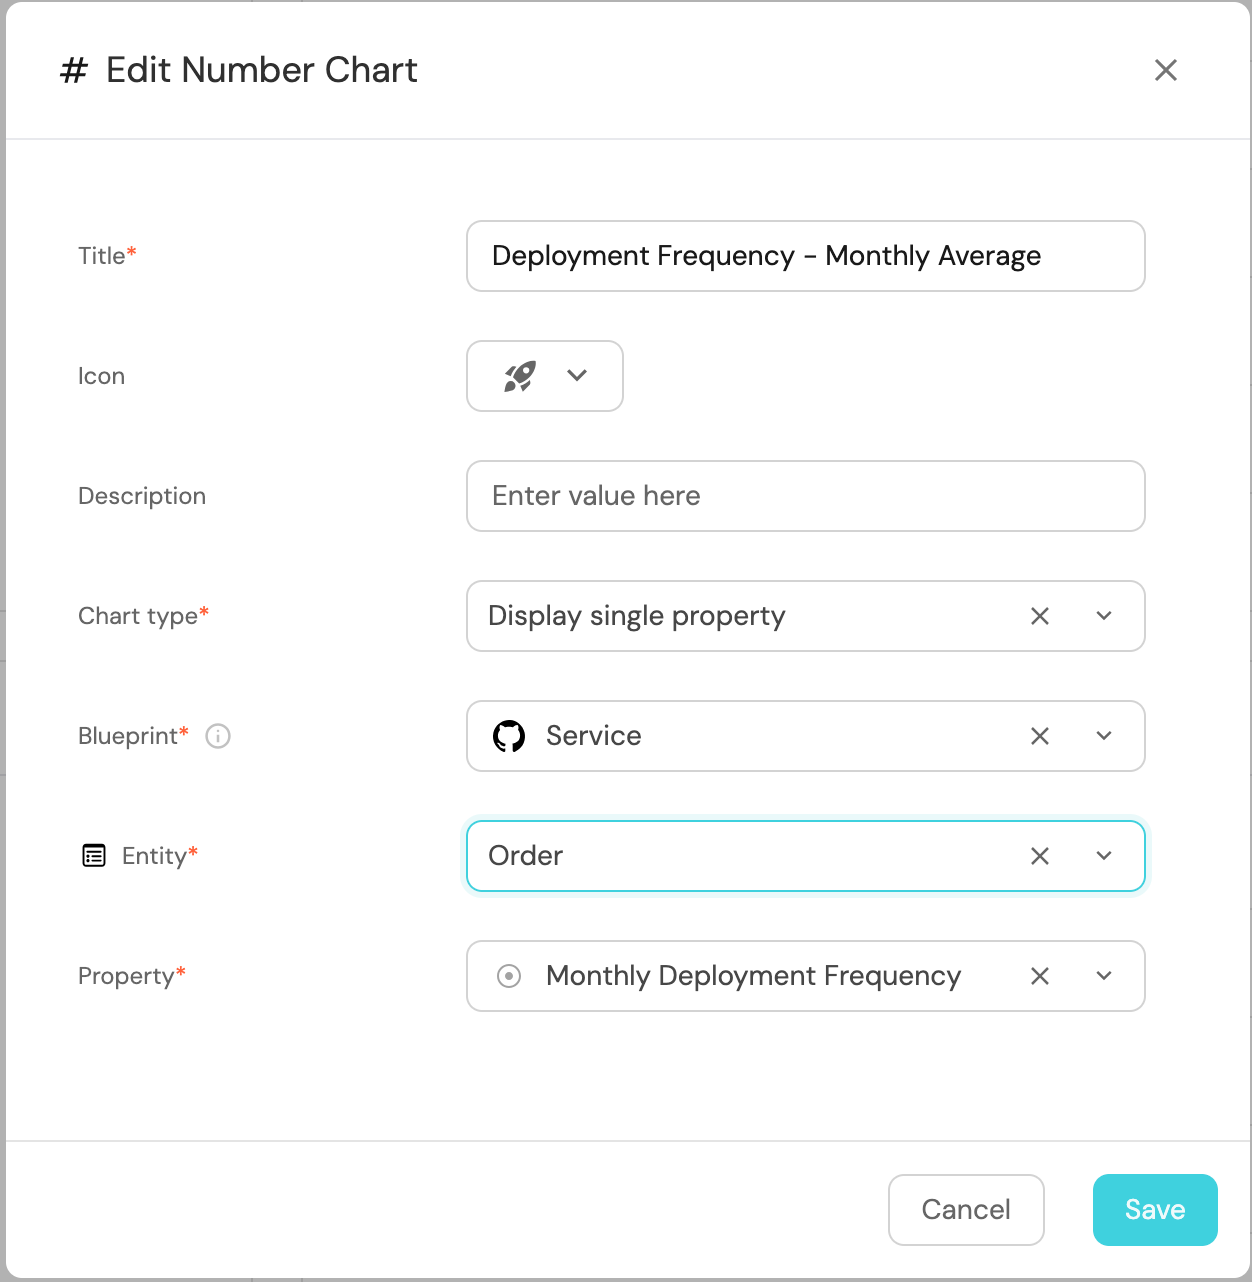
-
Click
Save.
Setup MTTR Widget
-
Click
+ Widgetand select Number Chart. -
Title:
MTTR – Monthly Average (Seconds), (add the pagerduty icon). -
Select
Display single propertyand choose Service as the Blueprint. -
Select an
Entityand chooseMean Time to Recoveryas the Property.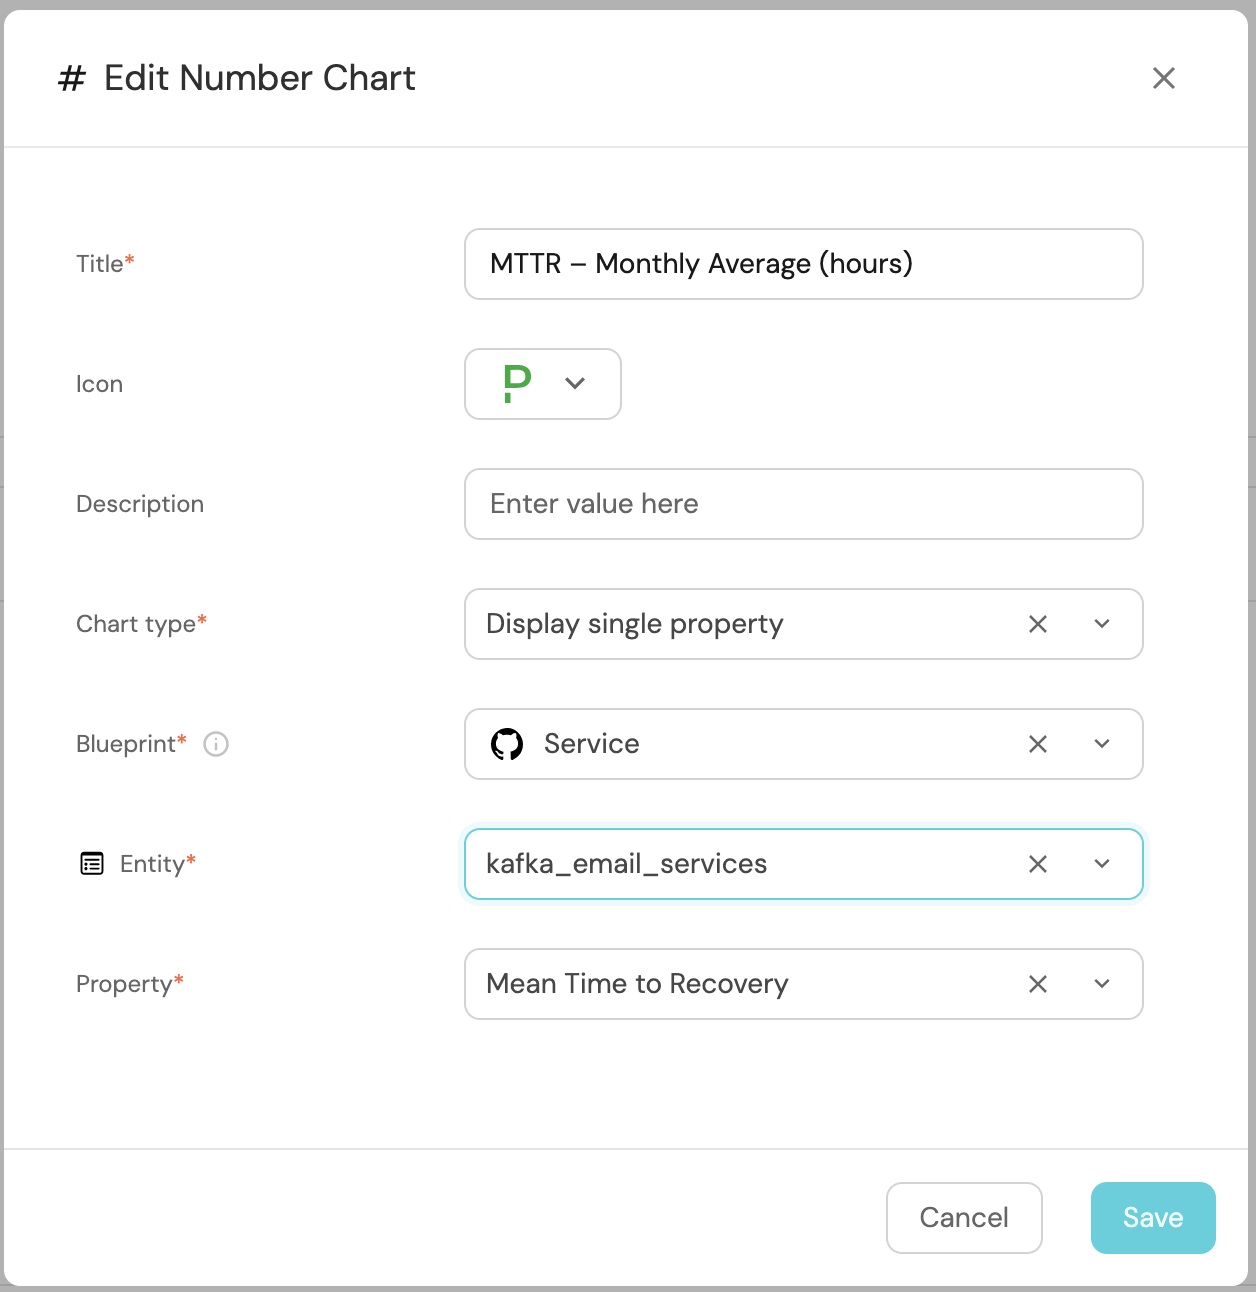
-
Click
Save.
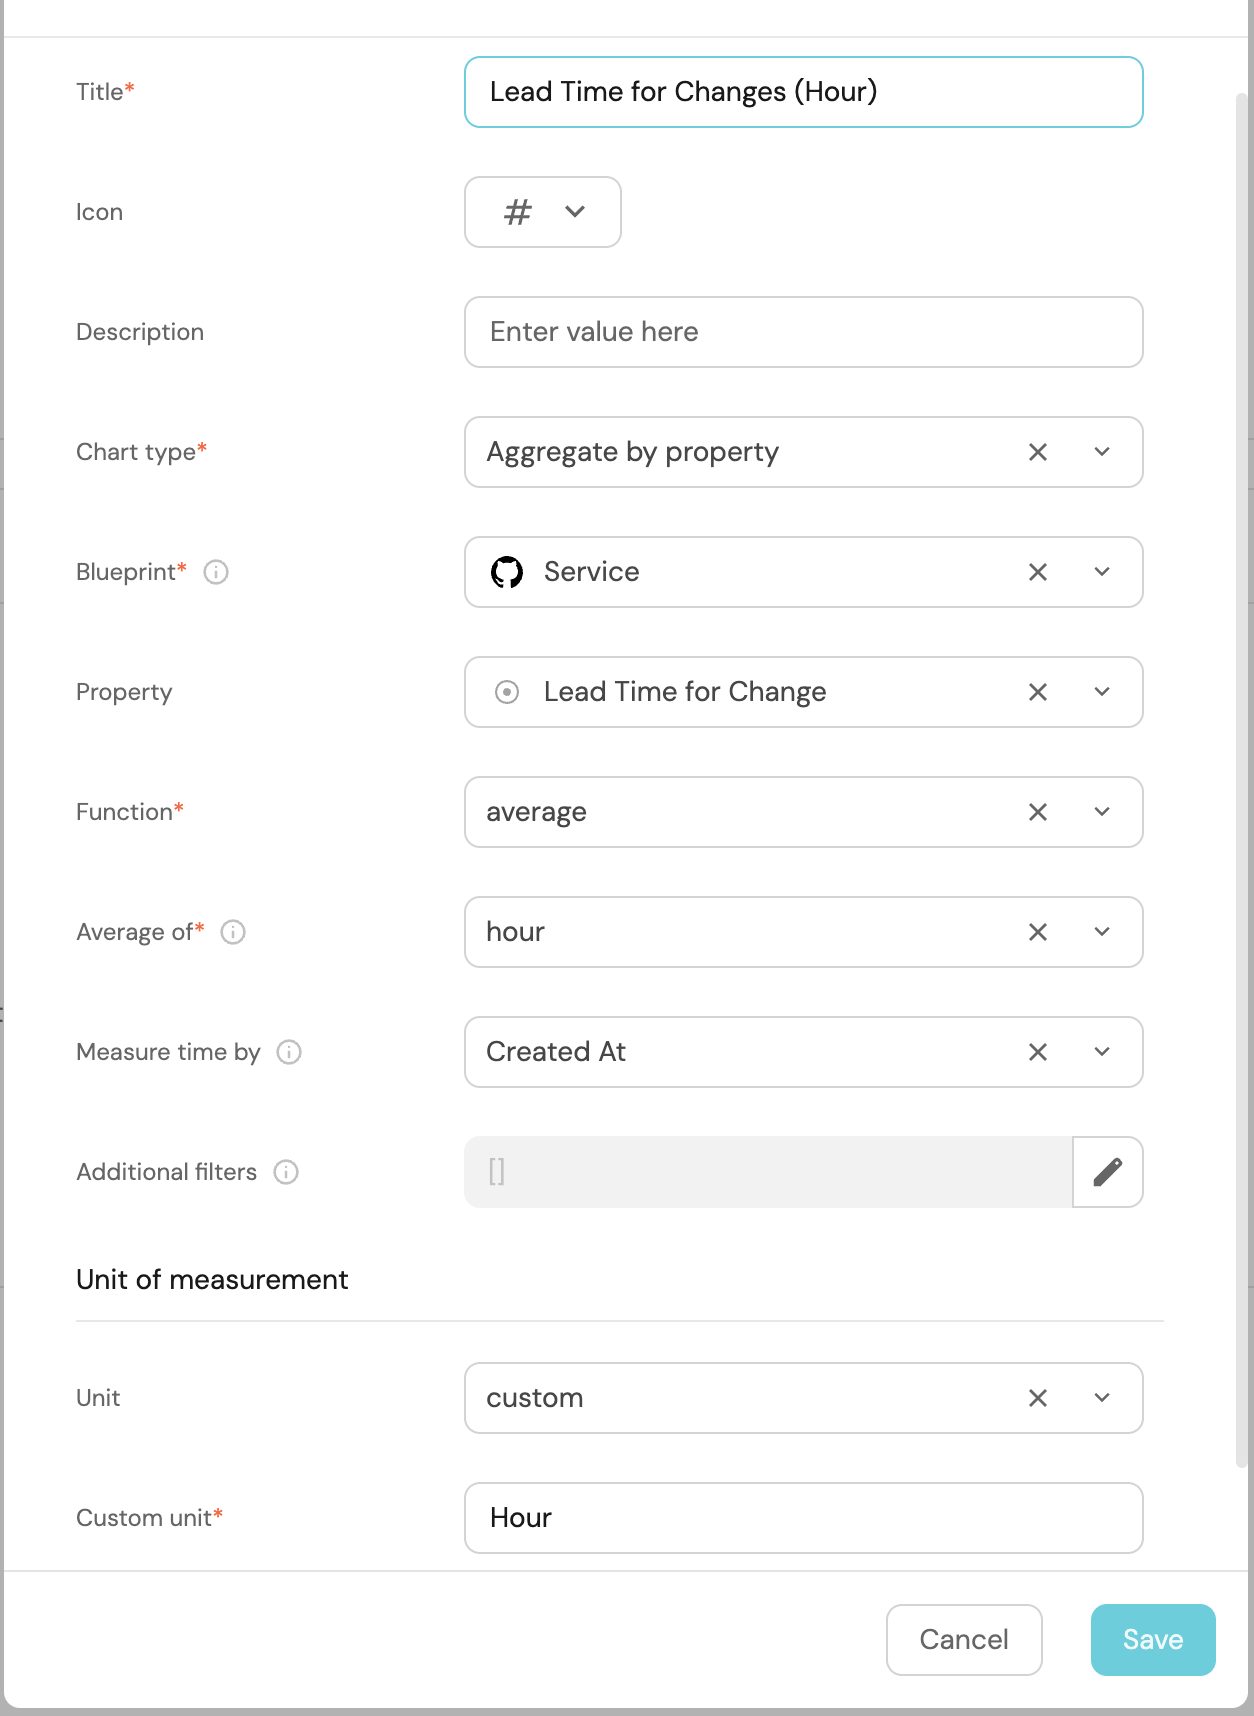
Setup Change Lead Time Widget
-
Click
+ Widgetand select Number Chart. -
Title:
Lead Time for Changes (Hour), (add LineChart icon). -
Select
Aggregate by propertyand choose Service as the Blueprint. -
Select
averageas the function and chooseHourfor Average of andcreatedAtas the Measure Time By. -
Add custom Unit for Unit of Measurement (Hours).
-
Click
Save.
Change Lead Time Over Time
-
Click
+ Widgetand select Line Chart. -
Title:
Change Lead Time Over Time, (add the LineChart icon). -
Choose Service as the Blueprint.
-
Select an
Entityand chooseLead time for changeas the Property. -
Set Time Interval to
Monthand Time Range toIn the past 365 days.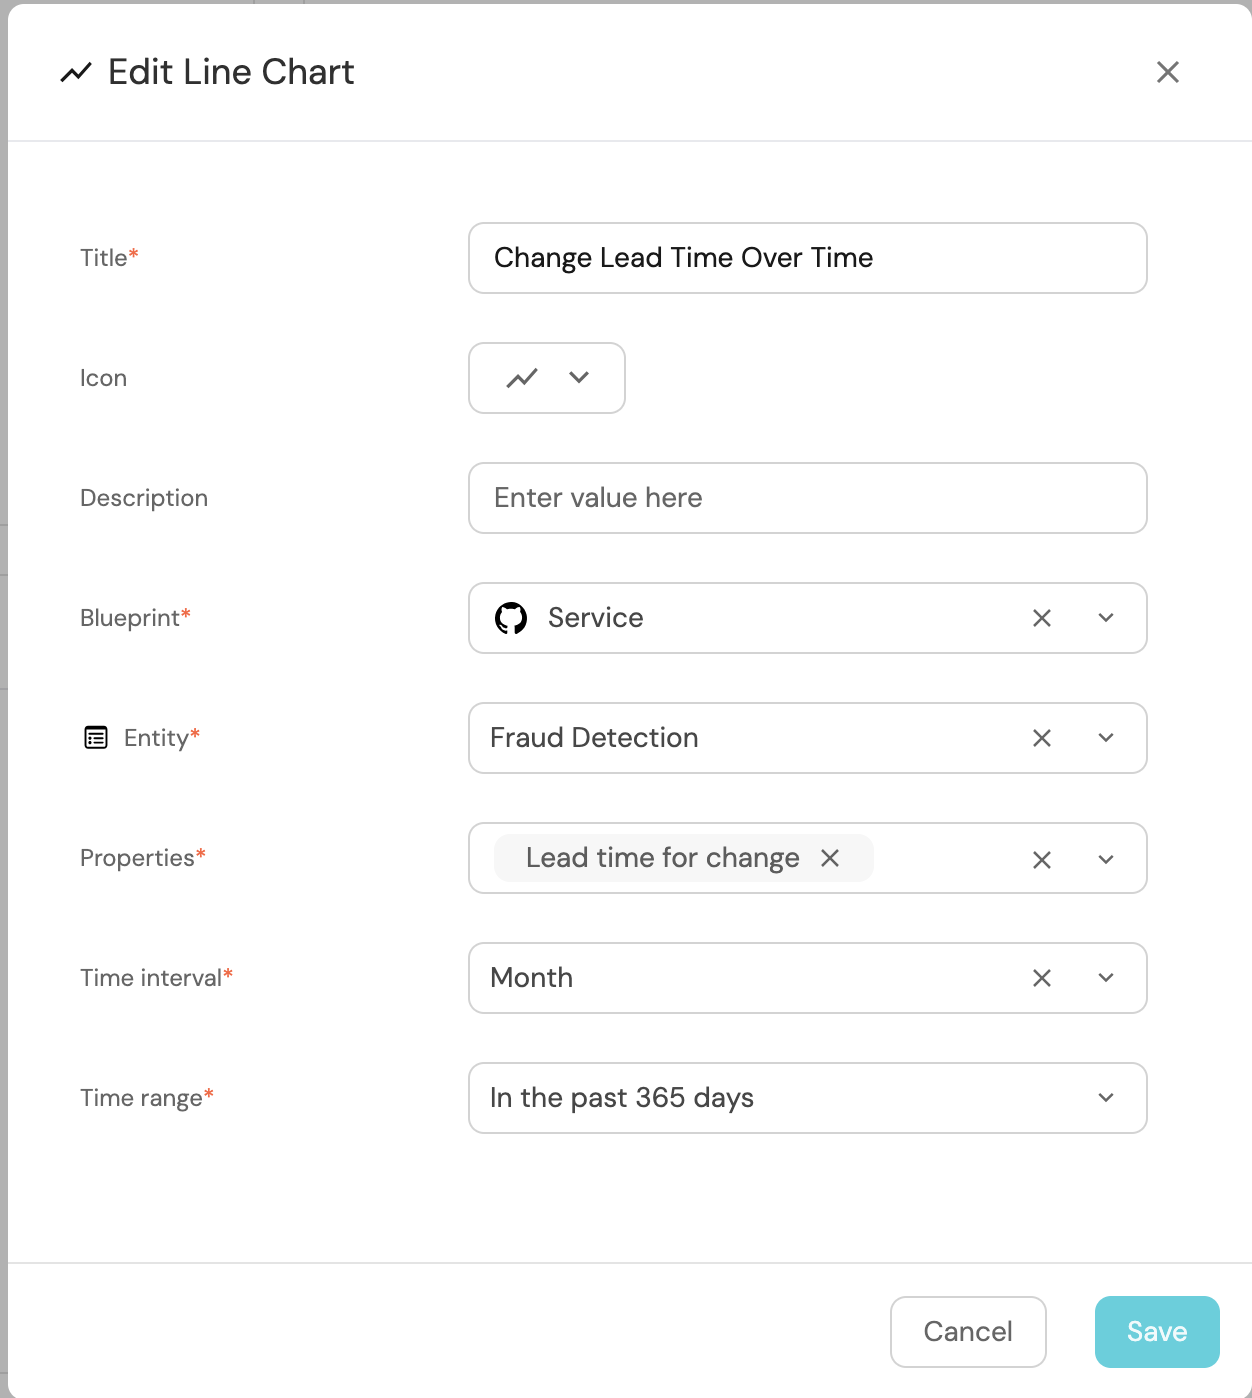
-
Click
Save.
Deployments Frequency Over Time
-
Click
+ Widgetand select Line Chart. -
Title:
Deployments Frequency Over Time(add the rocket icon). -
Select Service as the Blueprint.
-
Select
Monthly Deployment Frequencyas the Property. -
Set Time Interval to
Monthand Time Range toIn the past 365 days.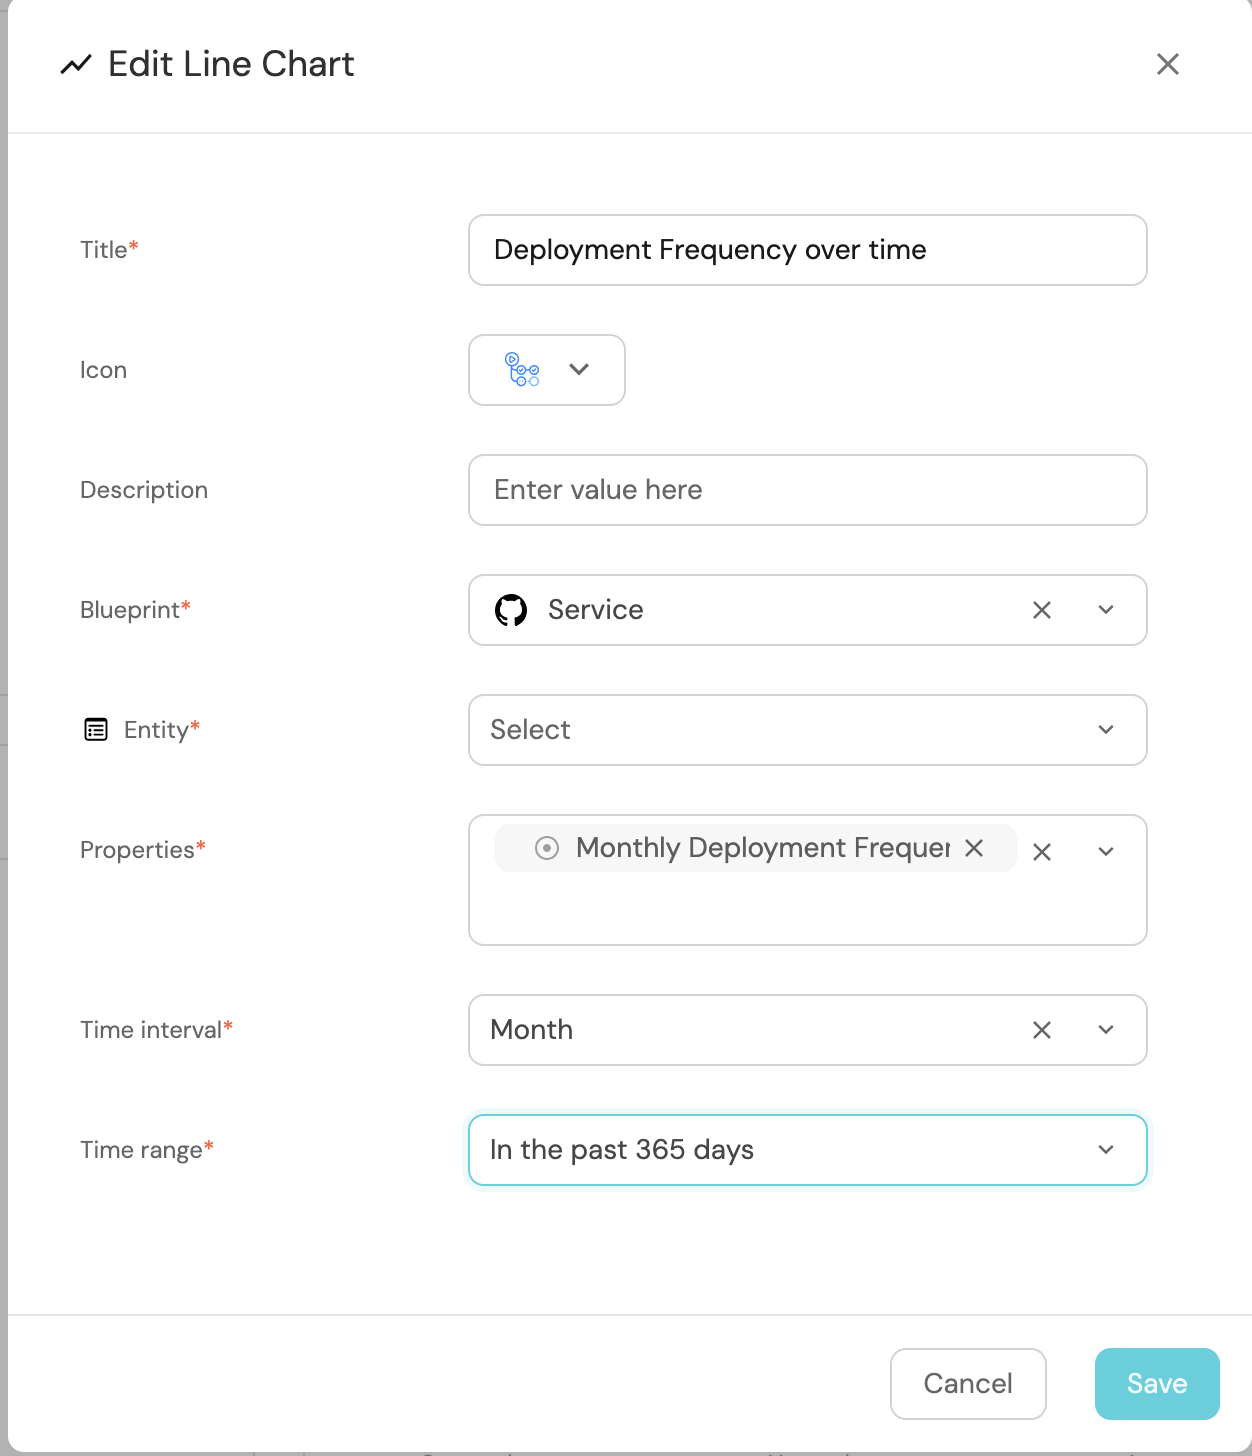
-
Click
Save.
It would be visually cleaner and more informative to group related widgets, such as the Line Chart and Number Chart widgets, side by side for easier comparison. You can replicate more examples by checking our dora metrics dashboard on the demo environment.
Congrats 🎉 You have successfully set up DORA metrics tracking in your portal 🔥