Track SLOs and SLIs for your services
This guide helps you set up a monitoring solution to track Service Level Indicators (SLIs) and compare them against Service Level Objectives (SLOs) using Port's integration with New Relic.
Common use cases
- Model and visualize service SLIs and compare them against SLOs.
- Create dashboards and reports to monitor SLOs over time.
Prerequisites
This guide assumes the following:
- You have a Port account and have completed the onboarding process.
- You have installed and set up Port's New Relic integration.
Set up data model
In this setup, we will create or update the New Relic Service Level blueprint.
Skip to update blueprint if you already have the blueprint.
Create the blueprint
Follow the steps below to create the New Relic Service Level blueprint:
-
Go to the Builder in your Port portal.
-
Click on "+ Blueprint".
-
Click on the
{...}button in the top right corner, and choose "Edit JSON". -
Add this JSON schema:
New Relic Service Level blueprint (Click to expand)
{
  "identifier": "newRelicServiceLevel",
  "description": "This blueprint represents a New Relic Service Level",
  "title": "New Relic Service Level",
  "icon": "NewRelic",
  "schema": {
    "properties": {
      "description": {
        "title": "Description",
        "type": "string"
      },
      "targetThreshold": {
        "icon": "DefaultProperty",
        "title": "Target Threshold",
        "type": "number"
      },
      "createdAt": {
        "title": "Created At",
        "type": "string",
        "format": "date-time"
      },
      "updatedAt": {
        "title": "Updated At",
        "type": "string",
        "format": "date-time"
      },
      "createdBy": {
        "title": "Creator",
        "type": "string",
        "format": "user"
      },
      "sli": {
        "type": "number",
        "title": "SLI"
      },
      "tags": {
        "type": "object",
        "title": "Tags"
      }
    },
    "required": []
  },
  "mirrorProperties": {
    "running_service_identifier": {
      "title": "runningServiceIdentifier",
      "path": "newRelicService.$identifier"
    },
    "domain": {
      "title": "Domain",
      "path": "newRelicService.domain"
    }
  },
  "calculationProperties": {
    "sloStatus": {
      "title": "SLO Status",
      "calculation": "if .properties.sli >= .properties.targetThreshold then \"Passed\" else \"Failed\" end",
      "type": "string",
      "colorized": true,
      "colors": {
        "Passed": "green",
        "Failed": "red"
      }
    }
  },
  "aggregationProperties": {},
  "relations": {
    "newRelicService": {
      "title": "New Relic service",
      "target": "newRelicService",
      "required": false,
      "many": false
    }
  }
} -
Click "Save" to create the blueprint.
Update the blueprint
Follow the steps below to update the New Relic Service Level blueprint:
-
Navigate to the
New Relic Service Levelblueprint in your Port Builder. -
Hover over it, click on the
...button on the right, and select "Edit JSON". -
Add the calculation property:
Calculation property (Click to expand)
"sloStatus": {
  "title": "SLO Status",
  "calculation": "if .properties.sli >= .properties.targetThreshold then \"Passed\" else \"Failed\" end",
  "type": "string",
  "colorized": true,
  "colors": {
    "Passed": "green",
    "Failed": "red"
  }
} -
Add these mirror properties:
Mirror properties (Click to expand)
"running_service_identifier": {
  "title": "runningServiceIdentifier",
  "path": "newRelicService.$identifier"
},
"domain": {
  "title": "Domain",
  "path": "newRelicService.domain"
}
Visualize metrics
In this section, you'll learn how to create dashboards that visualize key service metrics using SLIs and SLOs for production and engineering teams.
Create a dashboard
- Navigate to your software catalog.
- Click on the
+ Newbutton in the left sidebar. - Select New dashboard.
- Name the dashboard Production Deployment Overview and click
Create. - Repeat the same process to create an Engineering Overview dashboard.
You now have a blank dashboard where you can start adding widgets to visualize your SLIs and SLOs.
Add widgets
Production Deployment Overview - SLI vs SLO Table
-
Click
+ Widgetand select Table. -
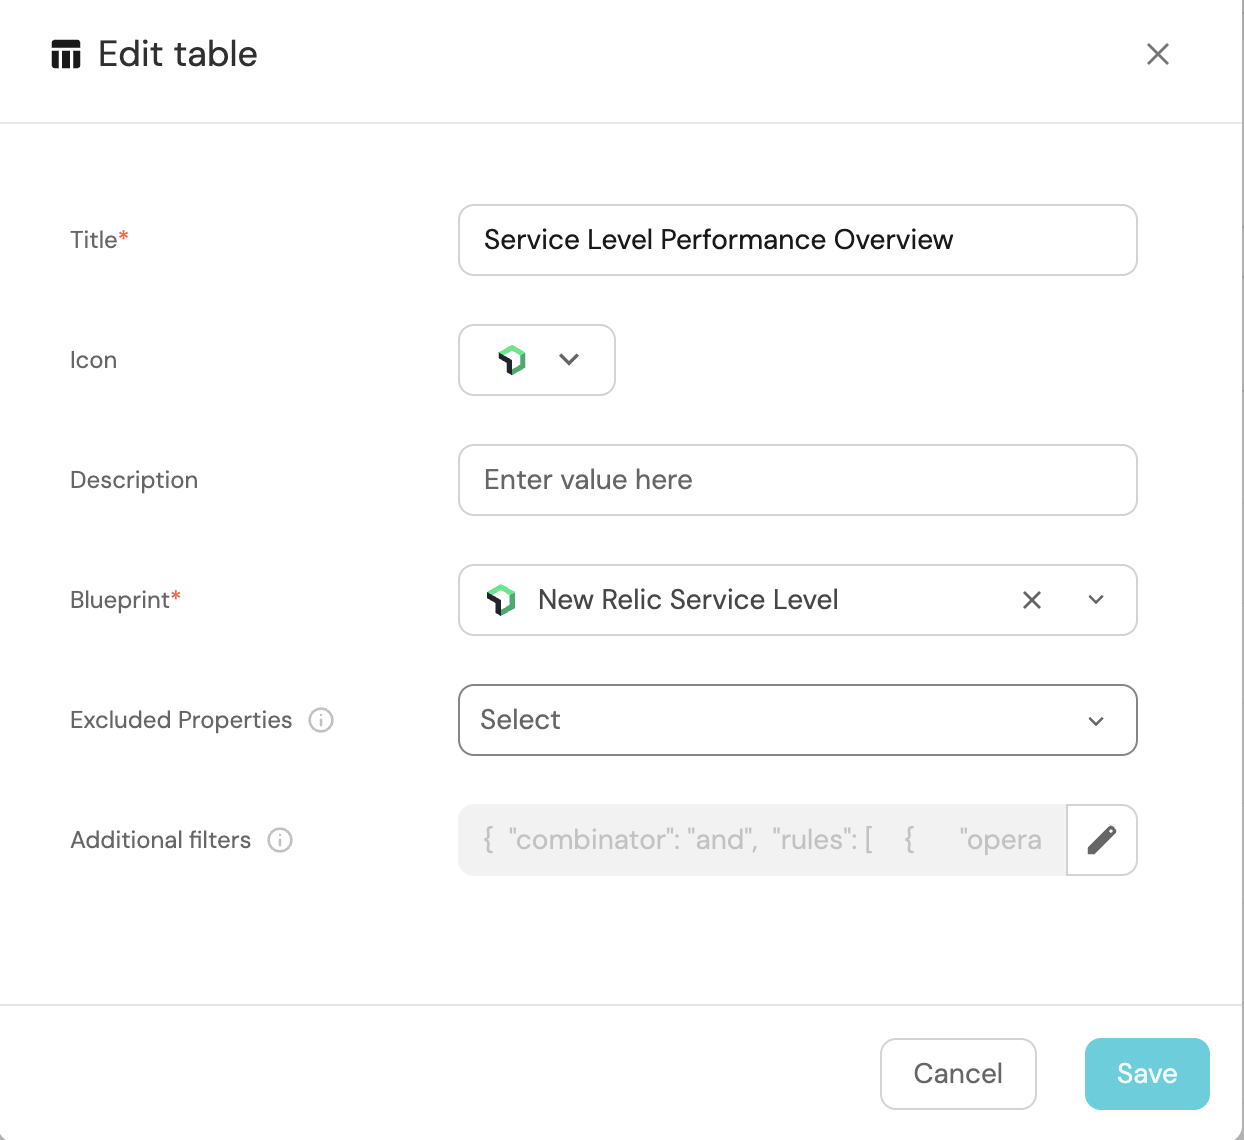
Title the widget Service Level Performance Overview.
-
Choose the New Relic Service Level blueprint.
-
Click Save.
-
Click on the
...button in the top right corner of the table and select Customize table. -
In the top right corner of the table, click on
Manage Propertiesbutton and add the following properties:- Running service identifier
- Target threshold
- SLI
- SLO Status
-
Click on the save icon on the far right top conner of the widget to save the state of the table.
This table gives you a high-level overview of how your services are performing against their SLOs.
Engineering Overview - Failed SLOs Table
-
Click
+ Widgetand select Table. -
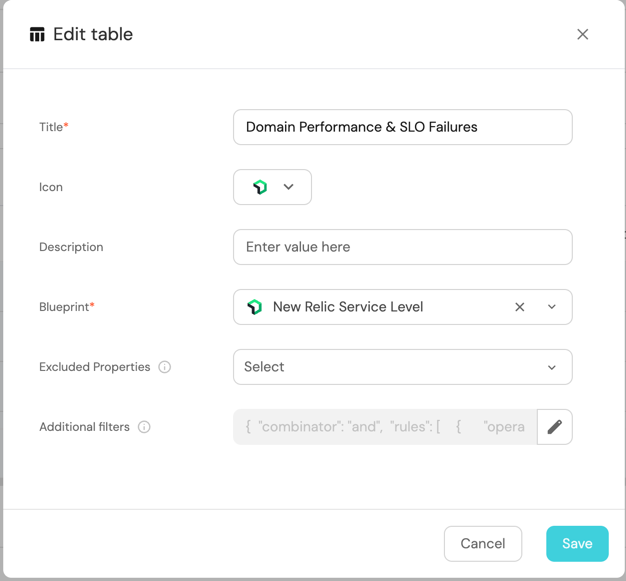
Title the widget Domain Performance & SLO Failures.
-
Choose the New Relic Service Level blueprint.
-
Click Save.
-
Click on the
...button in the top right corner of the table and select Customize table. -
Group the table by Domain.
-
Apply a filter to display only the Failed SLOs.
Visualize SLI trends
Tracking weekly performance trends for key services is crucial to identifying patterns and making data-driven decisions.
Weekly Latency Trend for API Gateway
- Click
+ Widgetand select Line Chart. - Title the chart API Gateway Weekly Latency Trend.
- Choose the New Relic Service Level blueprint.
- Select the Target Threshold and SLI properties to compare actual latency with the target.
- Set the time interval to Week.
- Click Save.
Weekly Write Failure Trend for Main Database
- Click
+ Widgetand select Line Chart. - Title the chart Main Database Weekly Write Failure Trend.
- Choose the New Relic Service Level blueprint.
- Select the Target Threshold and SLI properties to track write failures.
- Set the time interval to Week.
- Click Save.
Weekly Transaction Volume for Payment Processing
- Click
+ Widgetand select Line Chart. - Title the chart Payment Processing Weekly Transaction Volume Trend.
- Choose the New Relic Service Level blueprint.
- Select the Target Threshold and SLI properties to track transaction volumes.
- Set the time interval to Week.
- Click Save.
Team-Level and Organization-Level dashboards
You can also create dashboards specific to teams or organization-wide, depending on the scope of monitoring.
- First, add the following properties to the New Relic Service blueprint:
Calculation and aggregation properties
"calculationProperties": {
    "has_slo": {
      "title": "Has SLO",
      "icon": "DefaultProperty",
      "description": "Boolean for if SLO exists",
      "calculation": ".properties.number_of_slos != null",
      "type": "boolean"
    }
  },
  "aggregationProperties": {
    "number_of_slos": {
      "title": "Number of SLOs",
      "icon": "DefaultProperty",
      "type": "number",
      "target": "newRelicServiceLevel",
      "calculationSpec": {
        "func": "count",
        "calculationBy": "entities"
      }
    }
- Add the dashboards
Create My Team’s SLOs Dashboard (Team Lead View)
- Click
+ Newin the sidebar to create a new dashboard. - Name the dashboard My Team’s SLOs.
Create Organization SLOs Dashboard (SRE View)
- Click
+ Newin the sidebar to create a new dashboard. - Name the dashboard Organization SLOs.
SLO tables and charts
All SLOs Table
- Click
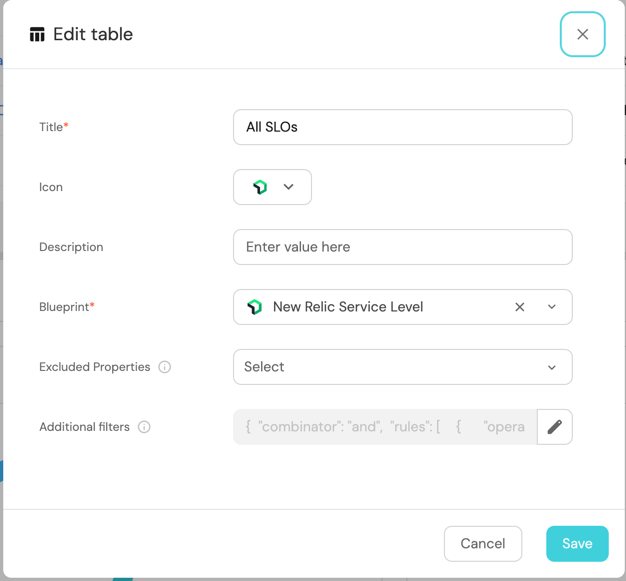
+ Widgetand select Table. - Title the widget All SLOs.
- Select the New Relic Service Level blueprint.
-
4.Click Save.
SLO Status Pie Chart
-
Click
+ Widgetand select Pie Chart. -
Title the chart SLO Status.
-
Choose the New Relic Service Level blueprint.
-
Select the SLO Status property as
Breakdown by Propertyvalue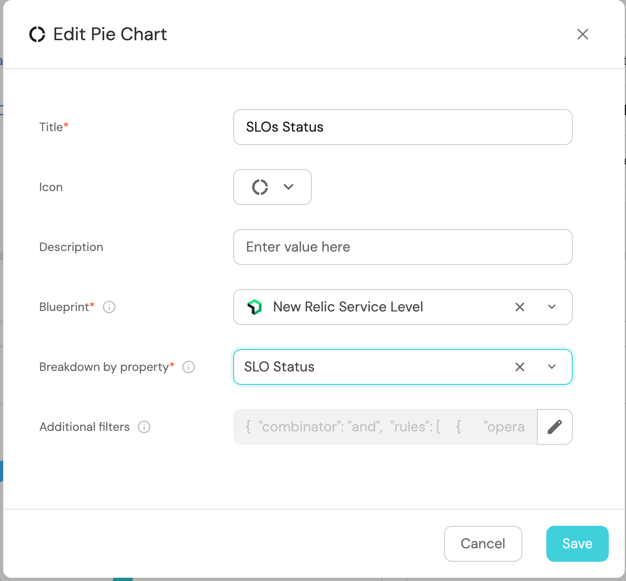
-
Click Save.
Services with a Defined SLO Pie Chart
-
Click
+ Widgetand select Pie Chart. -
Title the chart Services with a Defined SLO.
-
Choose the New Relic Service blueprint.
-
Select the Has SLO property as
Breakdown by Propertyfor ser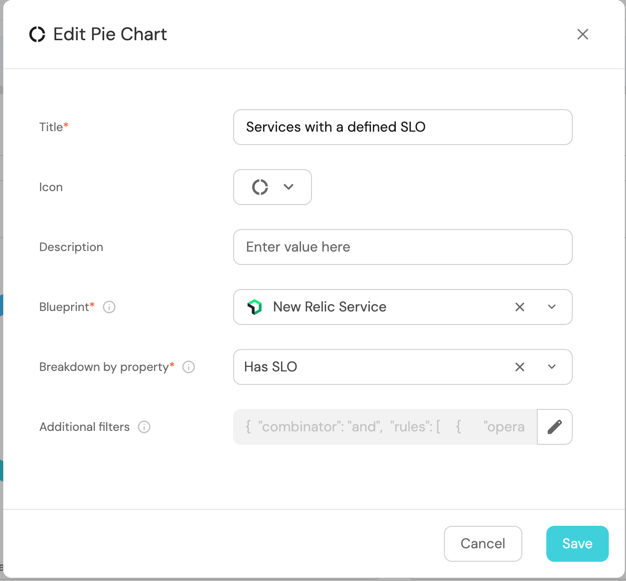
-
Click Save.
Latency SLI Chart
-
Click
+ Widgetand select Line Chart. -
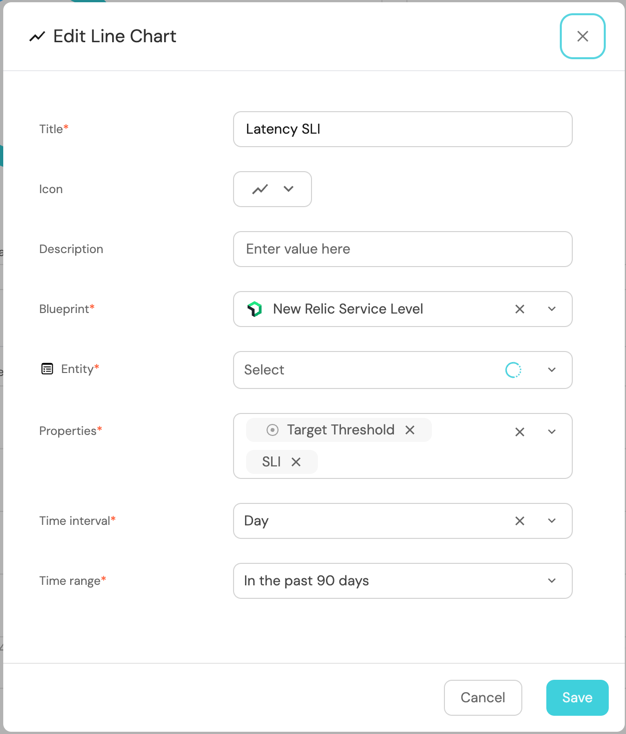
Title the chart Latency SLI.
-
Choose the New Relic Service Level blueprint.
-
Choose an
Entity -
Select the SLI and Target Threshold as
Properties. -
Set the time interval to Day and the time range to in the past 90 days.
-
Click Save.
Success SLI Chart
-
Click
+ Widgetand select Line Chart. -
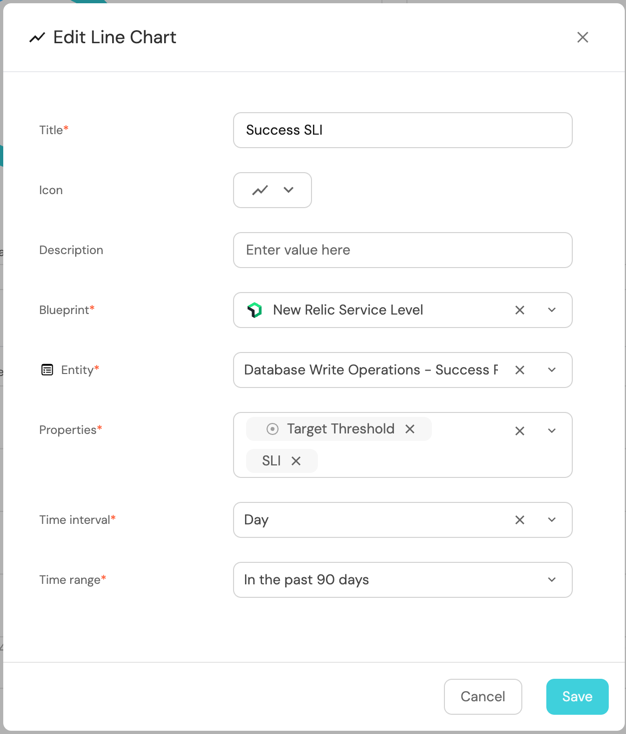
Title the chart Success SLI.
-
Choose the New Relic Service Level blueprint.
-
Choose an
Entity -
Select the SLI and Target Threshold as
Properties. -
Set the time interval to Day and the time range to in the past 90 days.
-
Click Save.
You can use the above steps for both team and an organization level dashboard.
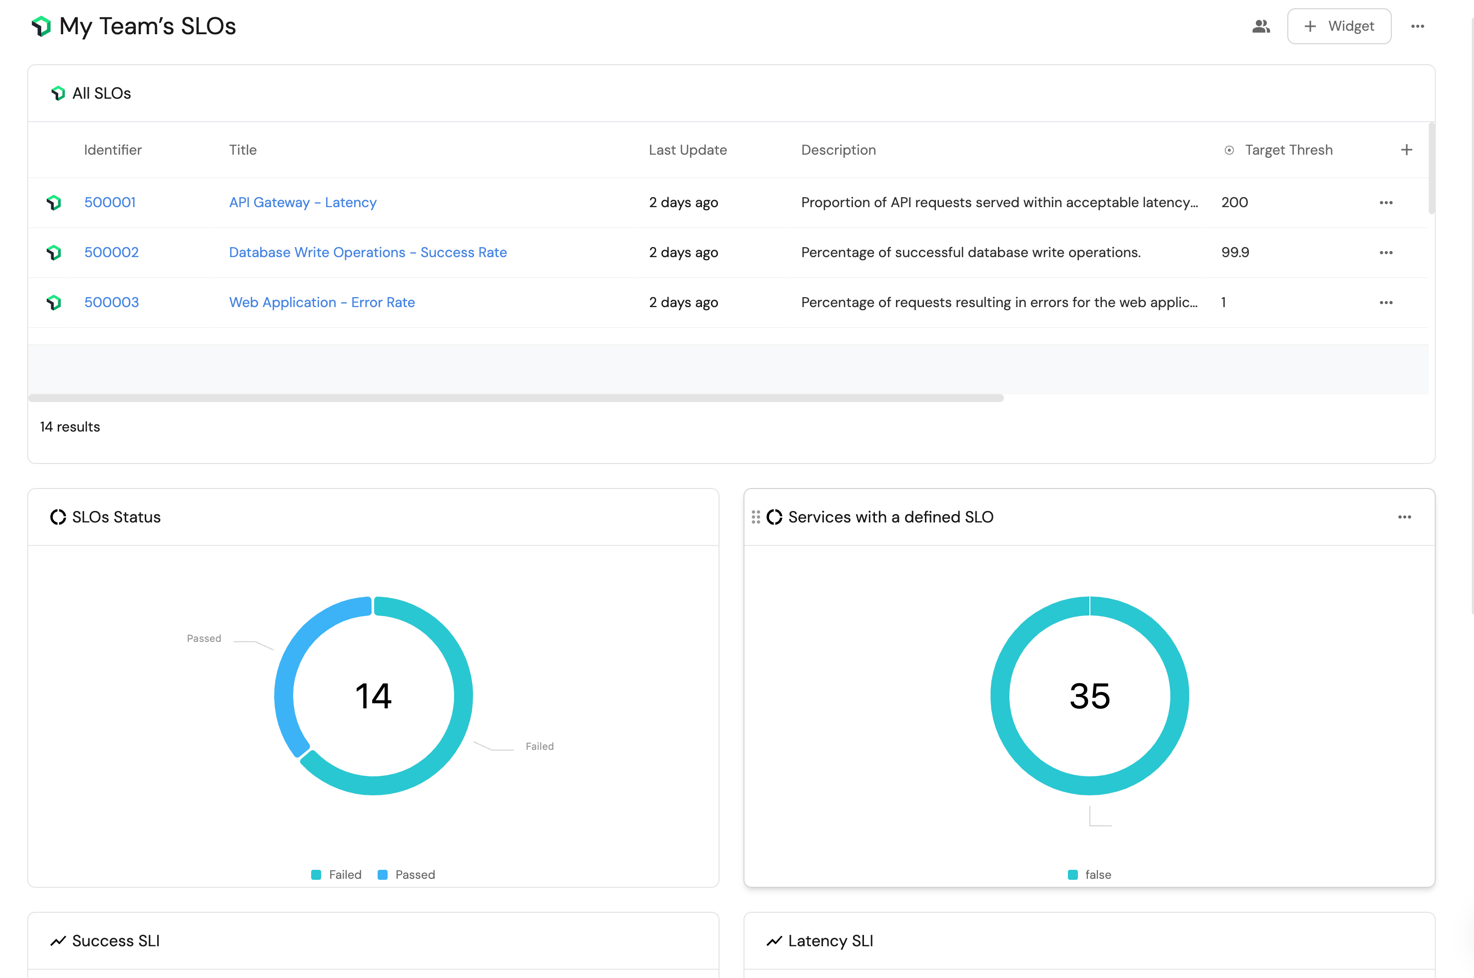
By following this guide, you have successfully set up dashboards to track your services' SLIs and SLOs. These visualizations provide real-time insights into service performance and compliance, allowing your teams to quickly identify and address underperforming services.