Visualize your services' Kubernetes runtime using ArgoCD
This guide takes 10 minutes to complete, and aims to demonstrate the value of Port's integration with ArgoCD.
- This guide assumes you have a Port account and that you have finished the onboarding process. We will use the
Serviceblueprint that was created during the onboarding process. - You will need an accessible k8s cluster. If you don't have one, here is how to quickly set-up a minikube cluster.
- Helm - required to install Port's ArgoCD integration.
The goal of this guide
In this guide we will model and visualize our services' Kubernetes resources (via ArgoCD).
After completing it, you will get a sense of how it can benefit different personas in your organization:
- Developers will be able to easily view the health and status of their services' K8s runtime.
- Platform engineers will be able to create custom views and visualizations for different stakeholders in the organization.
- Platform engineers will be able to set, maintain and track standards for K8s resources.
- R&D managers will be able to track any data about services' K8s resources, using tailor-made views and dashboards.
Install Port's ArgoCD integration
-
Go to your data sources page, click on
+ Data source, find theKubernetes Stackcategory and selectArgoCD. -
Follow the installation command for your preferred installation method:
- Helm
- ArgoCD
To install the integration using Helm, run the following command:
Remember to replace the following placeholders with your own values:
YOUR_PORT_CLIENT_ID- Your Port client IDYOUR_PORT_CLIENT_SECRET- Your Port client secretYOUR_ARGOCD_TOKEN- Your ArgoCD API token. Ensure that the token has sufficient permissions to read ArgoCD resources. You can configure the RBAC policy for the token user by following this guideYOUR_ARGOCD_SERVER_URL- The server url of your ArgoCD instance
# The following script will install an Ocean integration in your K8s cluster using helm
helm repo add --force-update port-labs https://port-labs.github.io/helm-charts
helm upgrade --install argocd port-labs/port-ocean \
	--set port.clientId="YOUR_PORT_CLIENT_ID"  \
	--set port.clientSecret="YOUR_PORT_CLIENT_SECRET"  \
	--set port.baseUrl="https://api.getport.io"  \
	--set initializePortResources=true  \
	--set integration.identifier="argocd"  \
	--set integration.type="argocd"  \
	--set integration.eventListener.type="POLLING"  \
	--set integration.secrets.token="YOUR_ARGOCD_TOKEN"  \
	--set integration.config.serverUrl="YOUR_ARGOCD_SERVER_URL"
To install the integration using ArgoCD, follow these steps:
- Create a
values.yamlfile inargocd/my-ocean-argocd-integrationin your git repository with the content:
Remember to replace the placeholders for TOKEN and SERVER_URL, which represents your ArgoCD API token and server url respectively. Ensure that the token has sufficient permissions to read ArgoCD resources. You can configure the RBAC policy for the token user by following this guide
initializePortResources: true
scheduledResyncInterval: 120
integration:
  identifier: my-ocean-argocd-integration
  type: argocd
  eventListener:
    type: POLLING
  config:
    serverUrl: SERVER_URL
  secrets:
    token: TOKEN
- Install the
my-ocean-argocd-integrationArgoCD Application by creating the followingmy-ocean-argocd-integration.yamlmanifest:
Remember to replace the placeholders for YOUR_PORT_CLIENT_ID YOUR_PORT_CLIENT_SECRET and YOUR_GIT_REPO_URL.
Multiple sources ArgoCD documentation can be found here.
ArgoCD Application
apiVersion: argoproj.io/v1alpha1
kind: Application
metadata:
  name: my-ocean-argocd-integration
  namespace: argocd
spec:
  destination:
    namespace: my-ocean-argocd-integration
    server: https://kubernetes.default.svc
  project: default
  sources:
  - repoURL: 'https://port-labs.github.io/helm-charts/'
    chart: port-ocean
    targetRevision: 0.1.18
    helm:
      valueFiles:
      - $values/argocd/my-ocean-argocd-integration/values.yaml
      parameters:
        - name: port.clientId
          value: YOUR_PORT_CLIENT_ID
        - name: port.clientSecret
          value: YOUR_PORT_CLIENT_SECRET
  - repoURL: YOUR_GIT_REPO_URL
    targetRevision: main
    ref: values
  syncPolicy:
    automated:
      prune: true
      selfHeal: true
    syncOptions:
    - CreateNamespace=true
- Apply your application manifest with
kubectl:
kubectl apply -f my-ocean-argocd-integration.yaml
What does the integration do?
After installation, the integration will:
- Create blueprints in your Builder (as defined here) that represent ArgoCD resources:
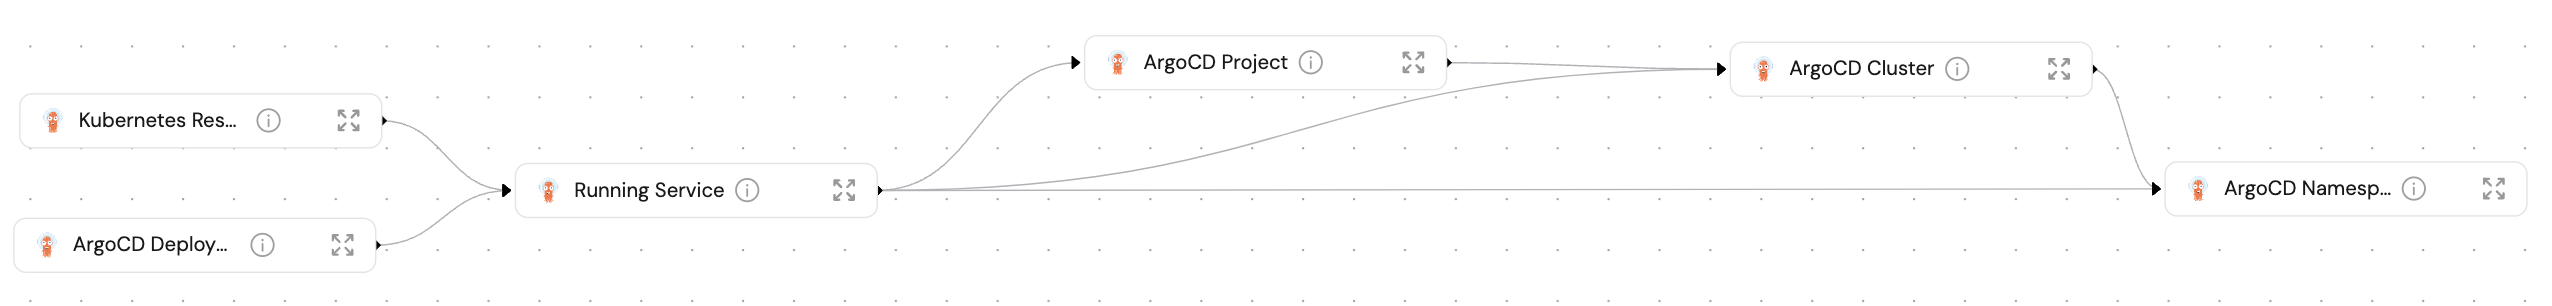
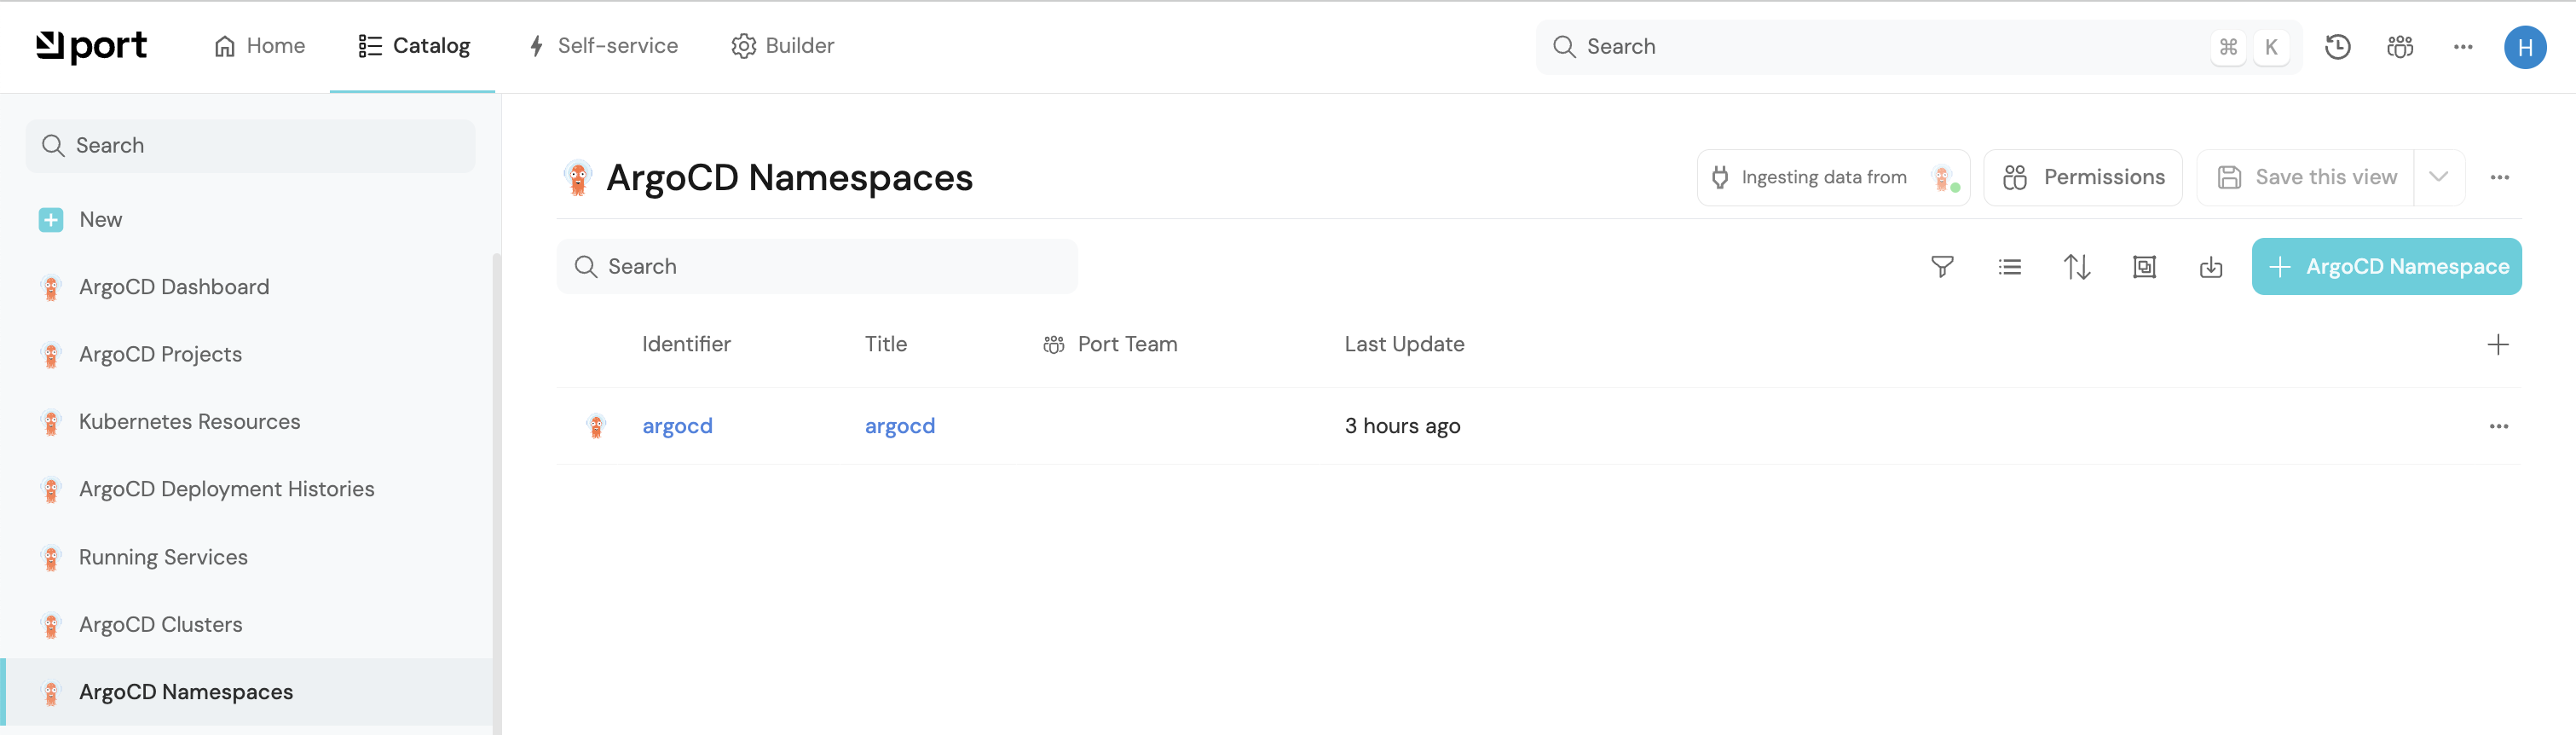
- Create entities in your Software catalog. You will see a new page for each blueprint containing your resources, filled with data from your Kubernetes cluster (according to the default mapping that is defined here):
-
Create a dashboard in your software catalog that provides you with some visual views of the data ingested from your K8s cluster.
-
Listen to changes in your ArgoCD resources and update your entities accordingly.
Define the connection between workloads and services
Now that we have our blueprints set up, we want to model the logical connection between our ArgoCD resources and the Service blueprint that already exists in our builder. This will grant us some helpful context in our software catalog, allowing us to see relevant ArgoCD application/s in a Service's context, and their corresponding data.
In this guide we will create a relation named Service for the Running Service blueprint, which represents the service a workload is running.
-
Go to your Builder, expand the
Running Serviceblueprint, and click onNew relation. -
Fill out the form like this, then click
Create:

Map your workloads to their services
You may have noticed that the service relation is empty for all of our Running Services. This is because we haven't specified which Running service belongs to which service. This can be done manually, or via mapping by using a convention of your choice.
In this guide we will use the following convention:
An Argo application with a label in the form of portService: <service-identifier> will automatically be assigned to a service with that identifier.
For example, an ArgoCD application with the label portService: awesomeService will be assigned to a service with the identifier awesomeService.
To achieve this, we need to update the ArgoCD integration's mapping configuration:
- Go to your data sources page, find the ArgoCD exporter card, click on it and you will see a YAML editor showing the current configuration.
Add the following block to the mapping configuration and clickResync:
  - kind: application
    selector:
      query: 'true'
    port:
      entity:
        mappings:
          identifier: .metadata.labels.portService
          blueprint: '"service"'
          properties: {}
  - kind: application
    selector:
      query: "true"
    port:
      entity:
        mappings:
          identifier: .metadata.uid
          blueprint: '"argocdApplication"'
          properties: {}
          relations:
            service: .metadata.labels.portService
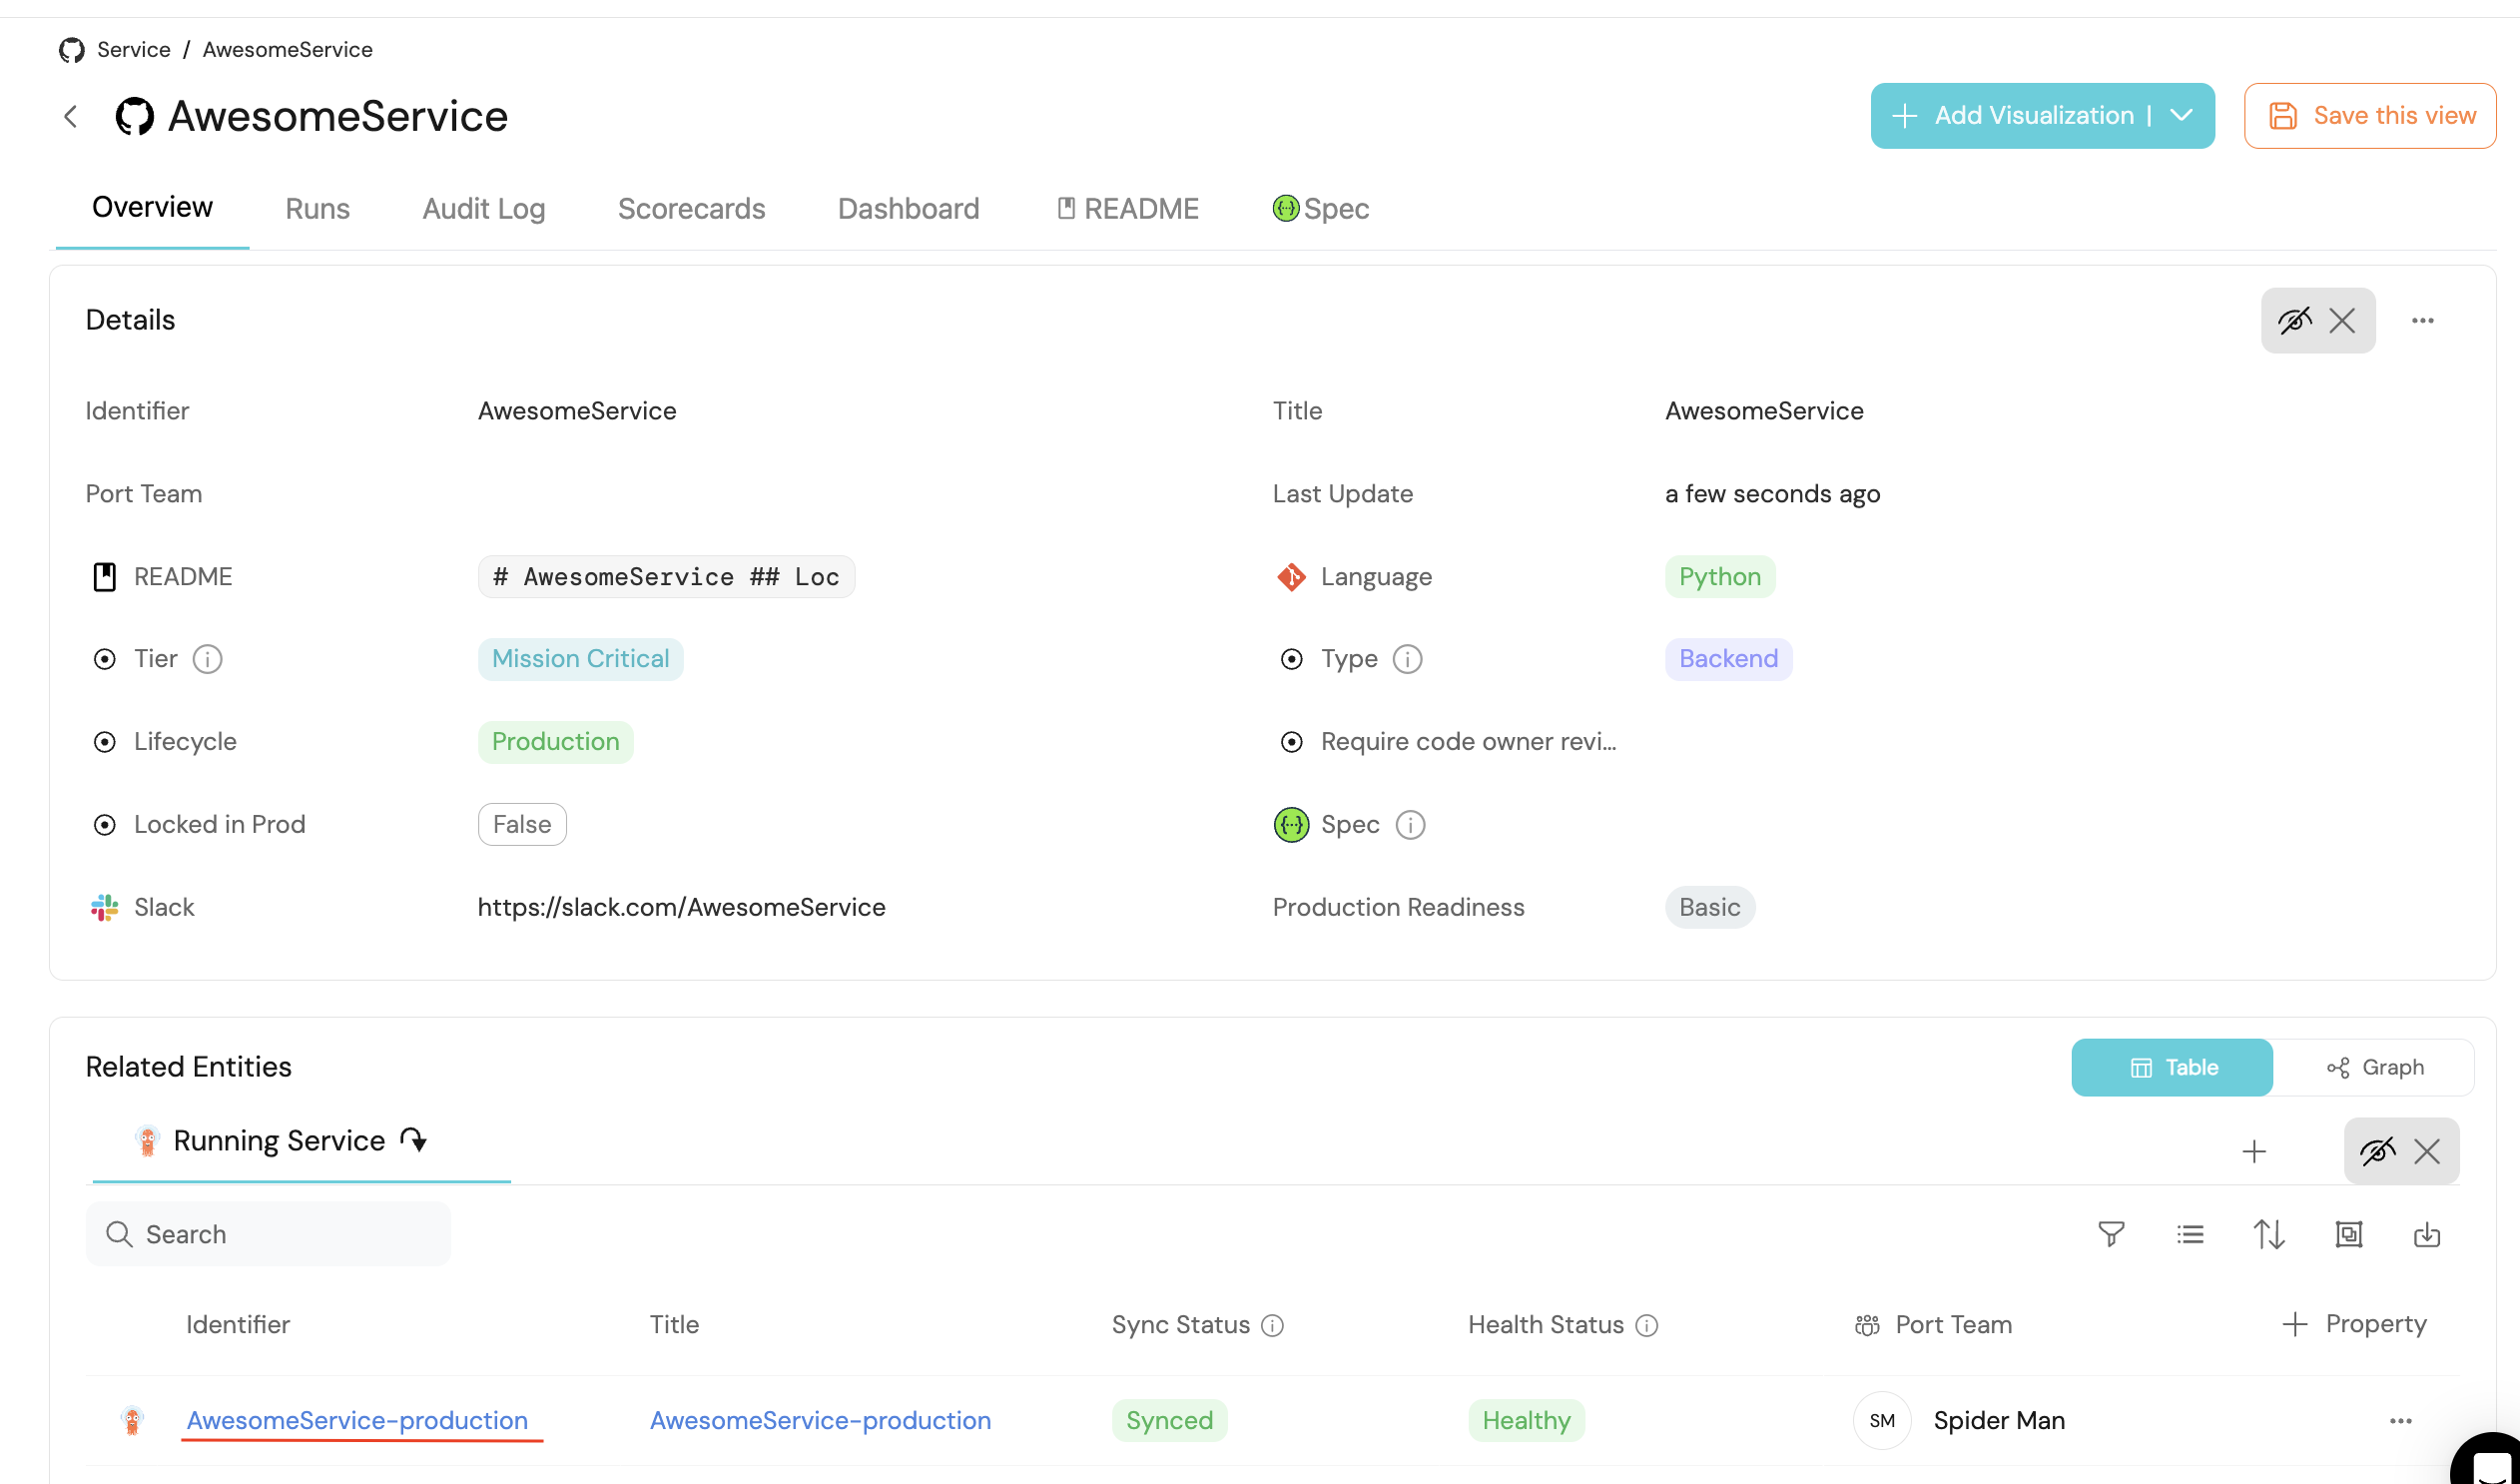
- Go to the services page of your software catalog. Click on the
Servicefor which you created the deployment. At the bottom of the page, you will see theRunning Servicesrelated to this service, along with all of their data:
Visualize data from your Kubernetes environment
We now have a lot of data about our Argo applications, and a dashboard that visualizes it in ways that will benefit the routines of our developers and managers. Since we connected our ArgoCD application(Running service) blueprint to our Service blueprint, we can now access some of the application's data directly in the context of the service.
Let's see an example of how we can add useful visualizations to our dashboard:
Show all "degraded" workloads of AwesomeService service belonging to a specific team
-
Go to your ArgoCD dashboard, click on the
+ Addbutton in the top right corner, then selectTable. -
Fill the form out like this, then click
Save: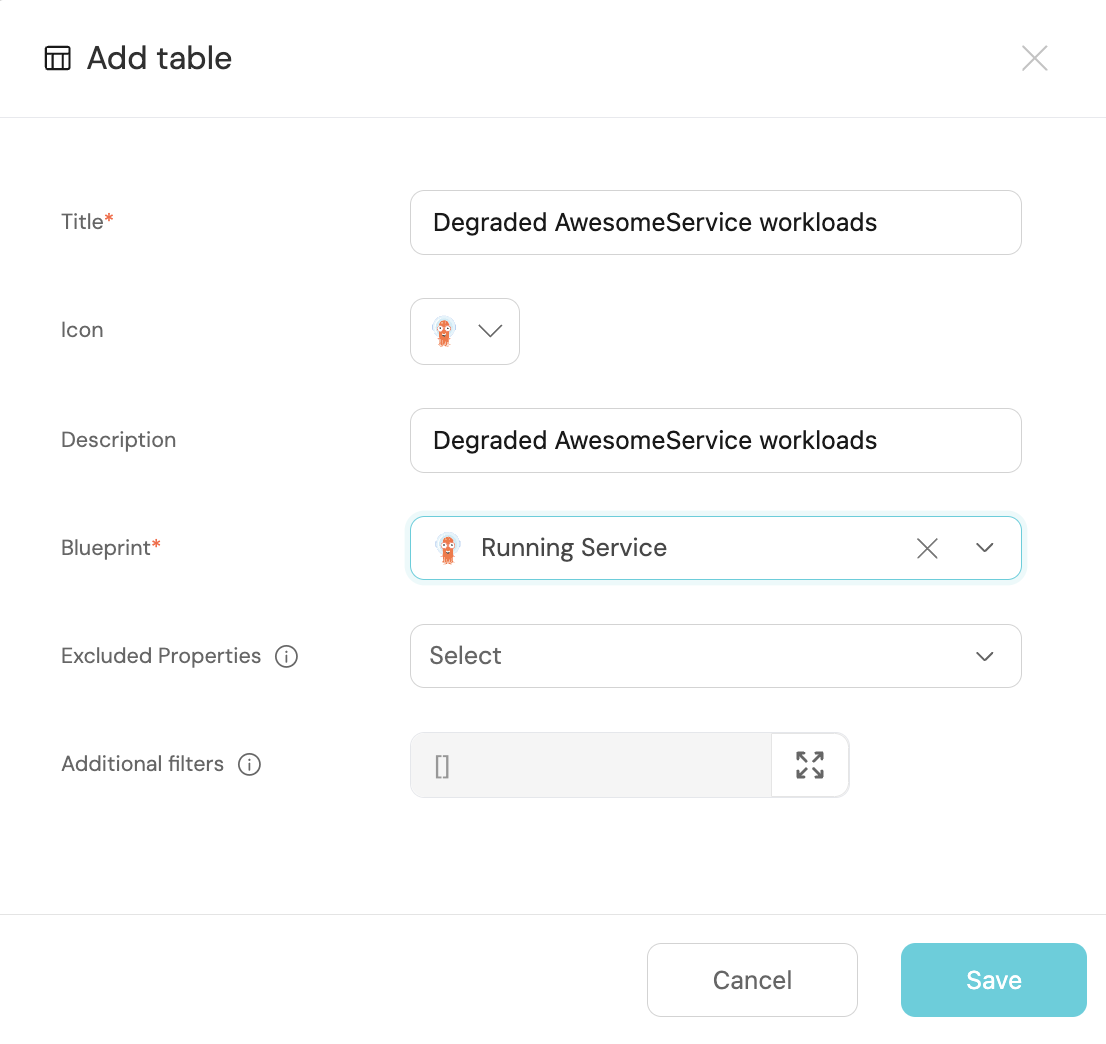
-
In your new table, click on the
Filtericon, then on+ Add new filter.
Add three filters by filling out the fields like this: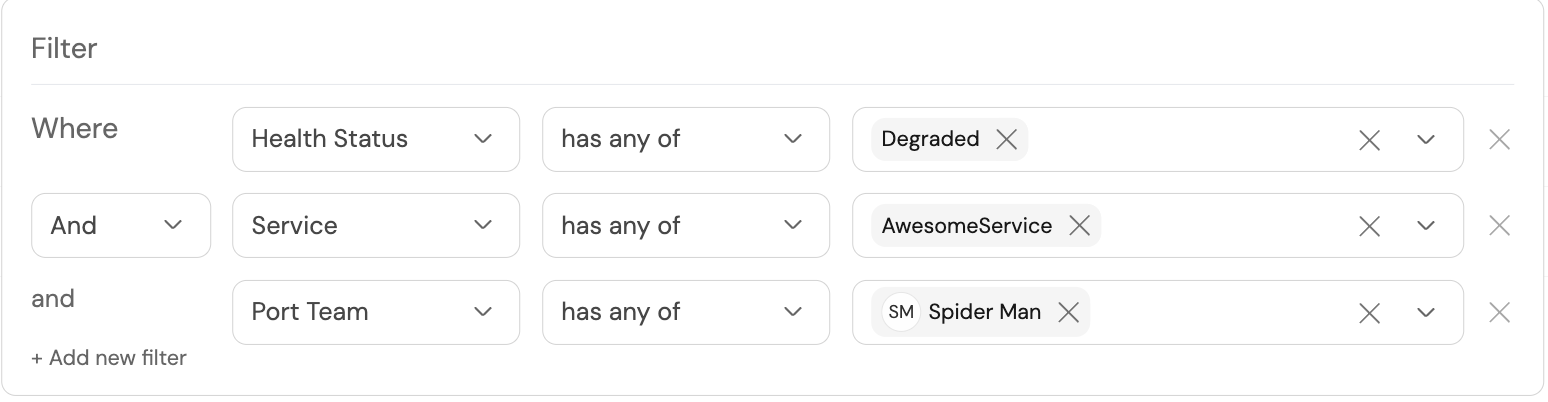
-
Your table should now display all services belonging to your specified team, whose
HealthisDegraded: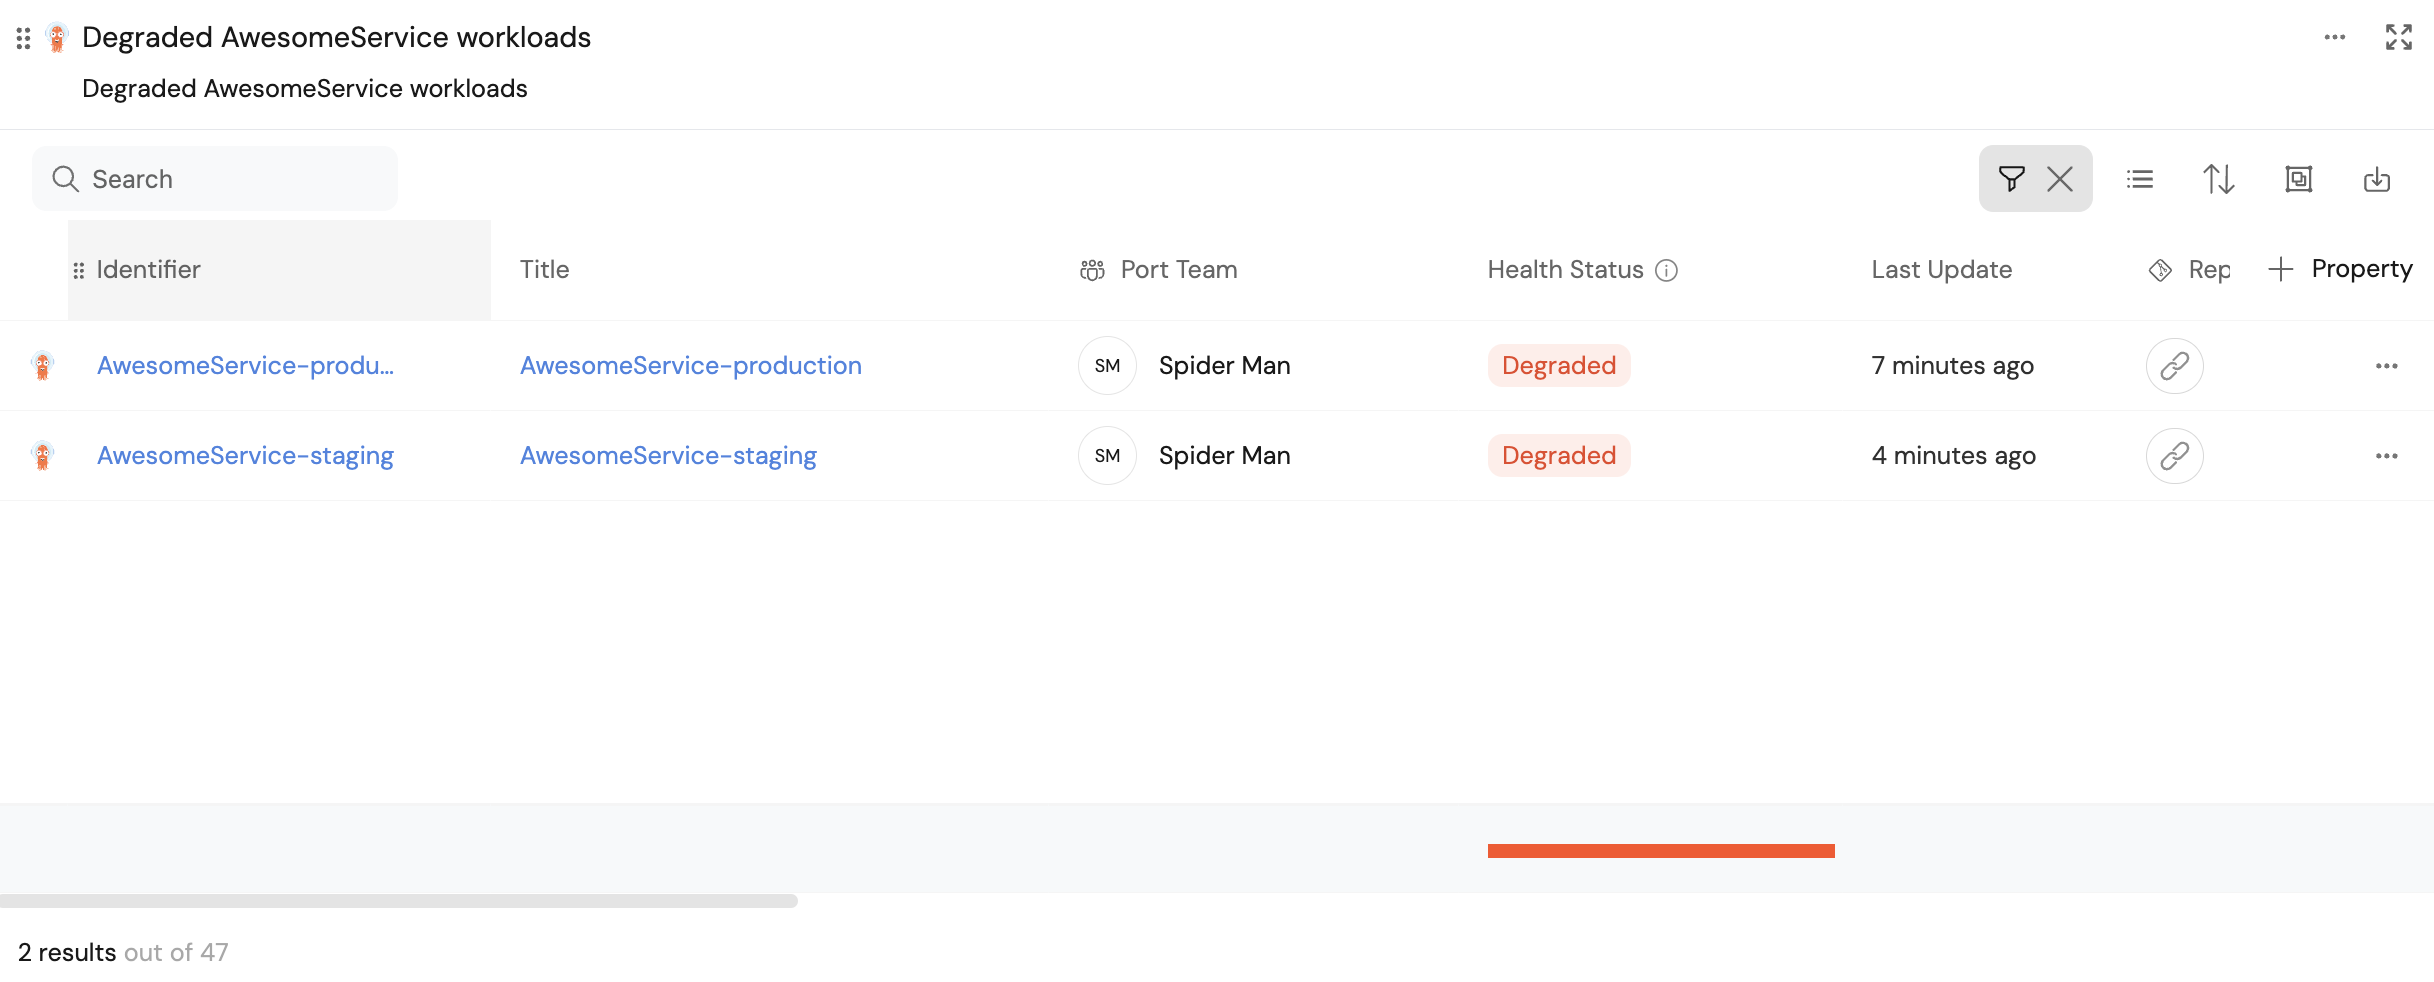
Possible daily routine integrations
- Send a slack message in the R&D channel to let everyone know that a new deployment was created.
- Notify Devops engineers when a service's availability drops.
- Send a weekly/monthly report to R&D managers displaying the health of services' production runtime.
Conclusion
Kubernetes is a complex environment that requires high-quality observability. Port's ArgoCD integration allows you to easily model and visualize your ArgoCD & Kubernetes resources, and integrate them into your daily routine.
Customize your views to display the data that matters to you, grouped or filtered by teams, namespaces, or any other criteria.