Dashboard widgets
Port supports various visualizations in the form of widgets, allowing you to display data from your software catalog using graphic elements, making it easier to make sense of large datasets.
Dashboards are available in the following locations:
- The Home page of your Port app - the home page itself is a dashboard, allowing you to add and customize any of the widgets described on this page.
- Every entity page can have a
dashboardtab with its own widgets. - The software catalog allows you to create customizable dashboard pages.
Widget types
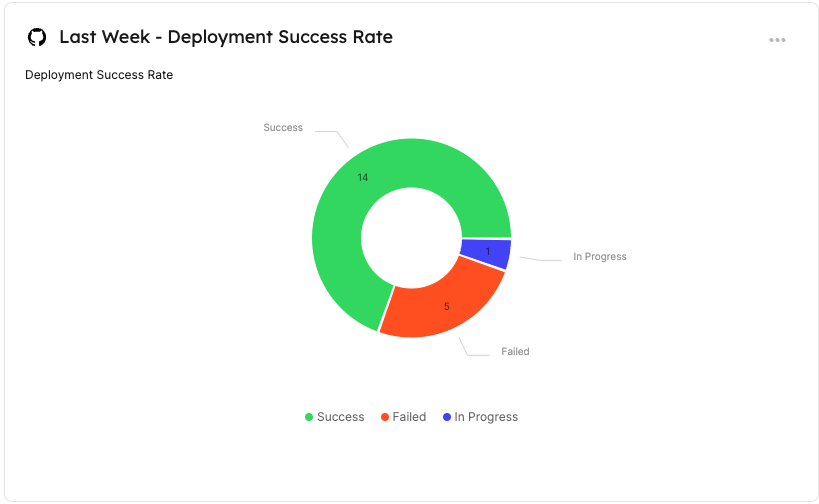
Pie chart
Pie charts illustrate data from entities in your software catalog divided by categories and entity properties.
Visualization properties
| Field | Type | Description | Default | Required |
|---|---|---|---|---|
Title | String | Pie chart title | null | true |
Icon | String | Pie chart Icon | null | false |
Description | String | Pie chart description | null | false |
Blueprint | String | The chosen blueprint from which related entities data is visualized | null | true |
Breakdown by property | String | Group your chart by a specific property | null | true |
Filters | Array | Filters to include or exclude specific data based on Port's Search Rules | [] | false |
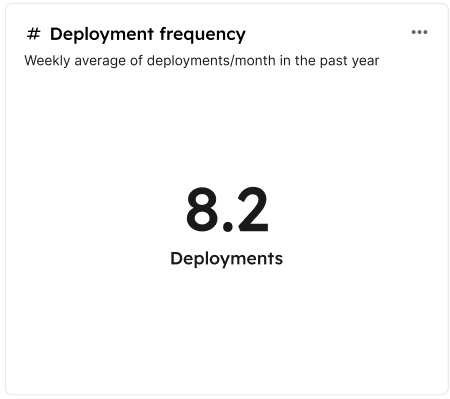
Number chart
Number charts display a number value related to an entity and its properties.
You can choose one of these chart types:
- Display single property - display a property from a specific entity.
- Count entities - display the amount of related entities or show an average by time.
- Aggregate by property - apply an aggregation function on number properties from multiple entities.
You can also filter entities so the aggregation number chart will only apply to a limited set of entities with Port's Search Rules
Number chart properties
| Field | Type | Description | Default | Required |
|---|---|---|---|---|
Title | String | Number Chart title | null | true |
Icon | String | Number Chart Icon | null | false |
Description | String | Number Chart description | null | false |
Chart type | String | Defines the operation type for the chart. Possible values: Display single property, Count entities, Aggregate by property | null | true |
Blueprint | String | The chosen blueprint from which related entities data is visualized from | null | true |
Chart type: display single property
| Field | Type | Description | Default | Required |
|---|---|---|---|---|
Entity | String | The chosen entity from which property data is visualized from | null | true |
Property | String | The number property which will be visulized | null | true |
Chart type: Count entities
| Field | Type | Description | Default | Required |
|---|---|---|---|---|
Function | String | count and average (by time). | null | true |
Average of | String | hour, day, week and month. | null | true |
Measure time by | String | Used to specify an alternative property to use as the time property for the average calculation instead of the default field which is createdAt. | createdAt | false |
Additional filters | Array | Filters to include or exclude specific data based on Port's search rules | [] | false |
Unit | String | The unit of the number chart. Possible Values: %, $, £, €, none, custom | null | true |
Custom unit | String | Text to display below the number value. The unitCustom key is only available when unit equals to custom | null | true |
Unit alignment | String | left, right, bottom. | null | true |
Chart type: Aggregate by property
| Field | Type | Description | Default | Required |
|---|---|---|---|---|
Property | String | The number chart value will be the selected property's aggregated value (according to the chosen function) | null | true |
Function | String | sum, min, max, average and median | null | true |
Average of | String | hour, day, week, month and total (divide the sum by the number of entities) | null | true |
Measure time by | String | Used to specify an alternative property to use as the time property for the average calculation instead of the default field which is createdAt. | createdAt | false |
Additional filters | Array | Filters to include or exclude specific data based on Port's search rules | [] | false |
Unit | String | The unit of the number chart. Possible Values: %, $, £, €, none, custom | null | true |
Custom unit | String | Text to display below the number value. The unitCustom key is only available when unit equals to custom | null | true |
Unit alignment | String | left, right, bottom. | null | true |
When performing calculations of average time intervals, such as by hour, day, week, or month, it is important to note that any partial interval is considered as a full interval. This approach ensures consistency across different time units.
For example, if the dataset includes information spanning across 2 hours and 20 minutes, but the selected average timeframe is hour, then the summed value will be divided by 3 hours.
Line chart
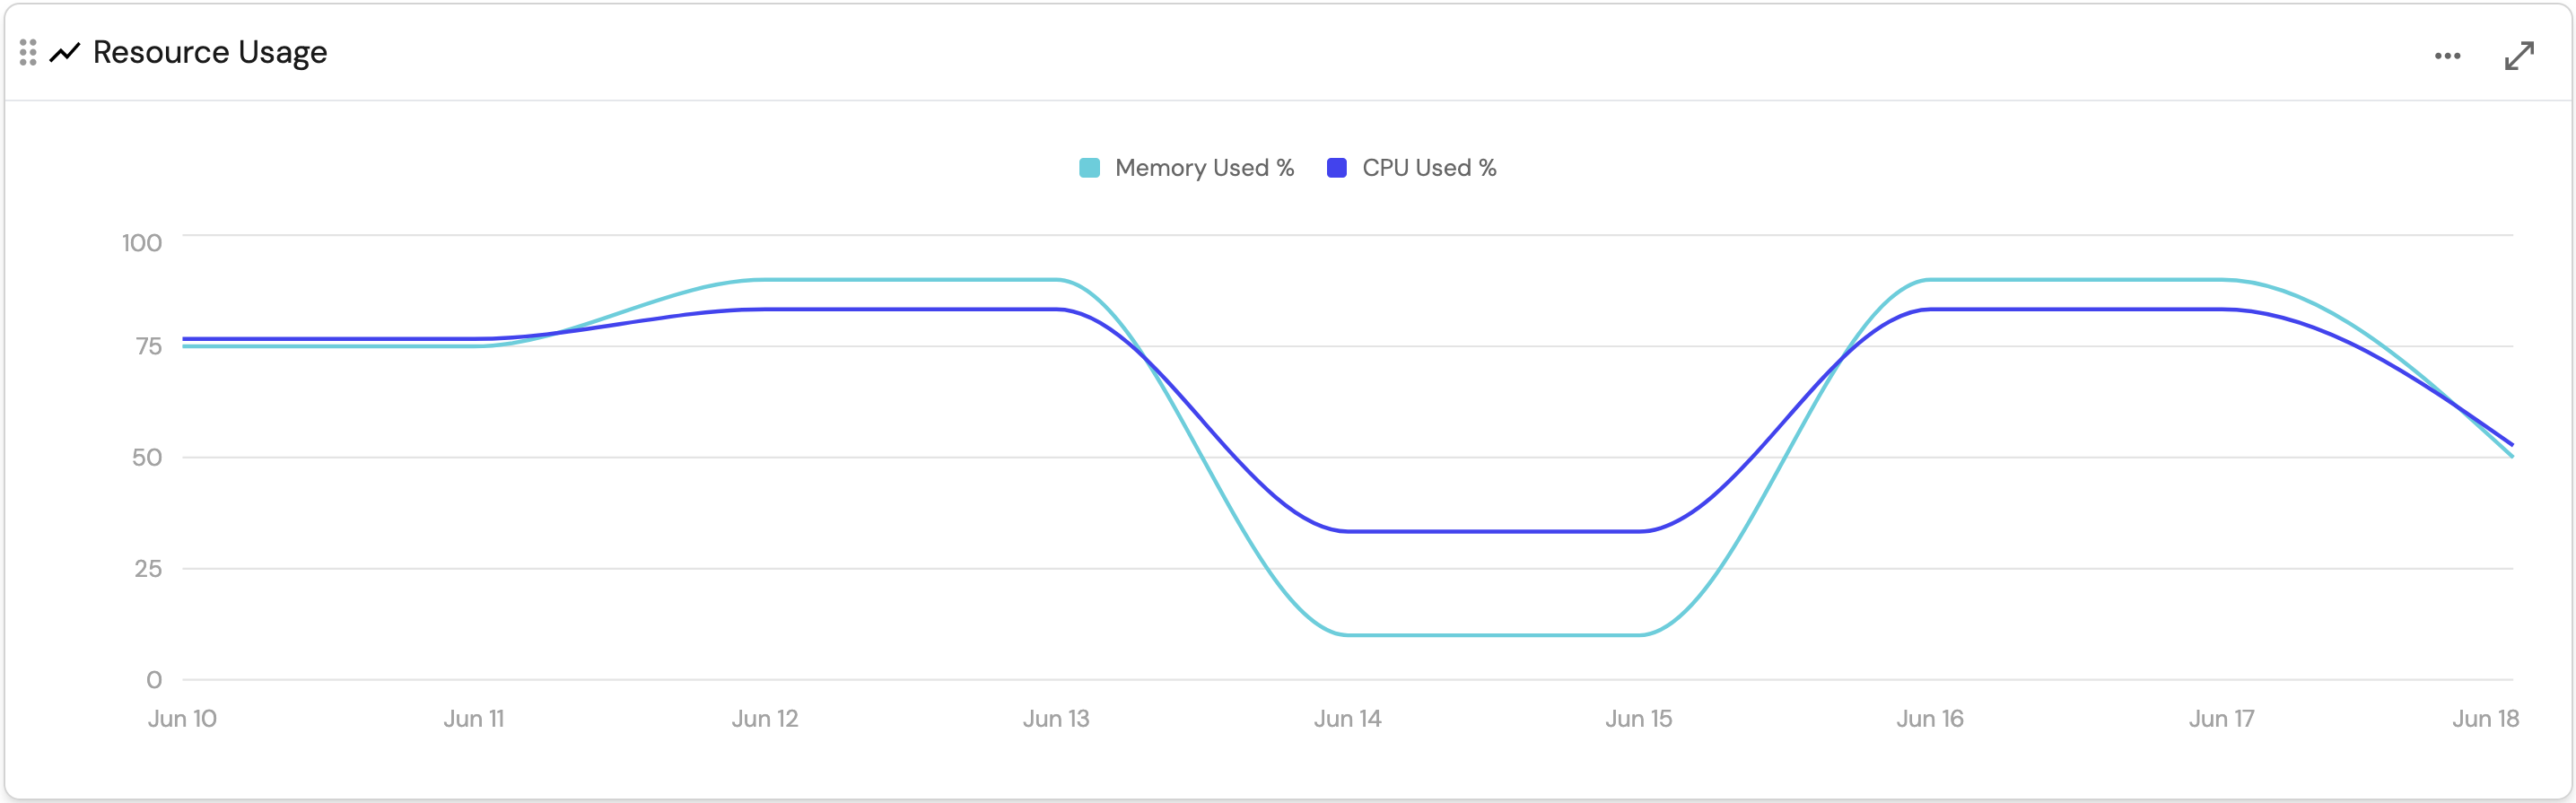
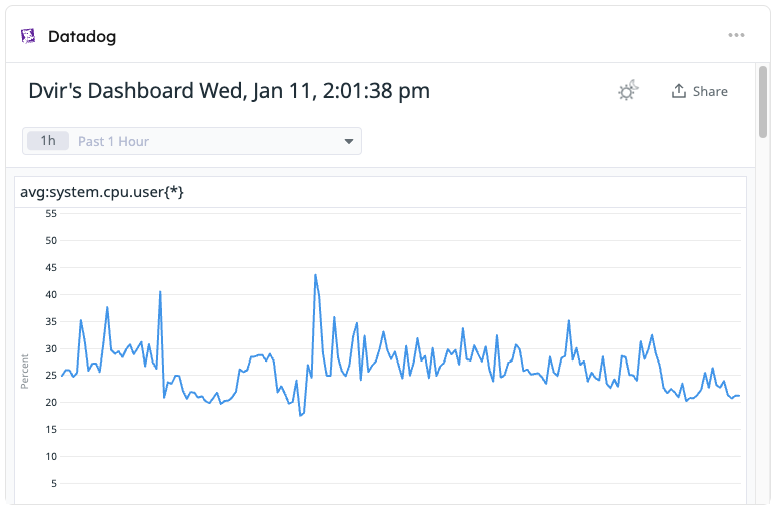
Line charts display trends of number properties over time.
When creating a line chart, you need to choose a blueprint, then choose one of its entities, and finally choose one or more of the entity's number properties to visualize.
When creating a line chart in an entity page, the chosen entity will be the entity whose page you are on.
Additionally, you need to specify the following properties:
- Time interval - the amount of time between each data point in the chart.
- Time range - how far back in time the chart will display data.
The chart will display the property values over the span of the selected time range, using the selected intervals.
The x-axis represents the time and the y-axis representing the property values.
For example, here is a line chart displaying a service's resource usage over the span of a week, in daily intervals:
Line chart properties
| Field | Type | Description | Default | Required |
|---|---|---|---|---|
Title | String | Chart title | null | true |
Icon | String | Chart Icon | null | false |
Description | String | An optional description for the chart | null | false |
Blueprint | String | The chosen blueprint | null | true |
Entity | String | The chosen entity | null | true |
Properties | Array | The chosen number property/ies to visualize | null | true |
Time interval | String | The time interval to display in the x-axis of the chart. Possible values: hour, day, week, month | null | true |
Time range | String | The time range of the displayed data. Possible values change according to selected time interval - the longer the interval, the longer the available ranges | null | true |
Potential use cases
Line charts can display data for any number property, including aggregation and calculation properties.
Consider the following use case:
Say you have a Kubernetes cluster blueprint, with a related node blueprint representing the cluster's nodes. Each node has a cost property indicating its monthly cost.
We can create an aggregation property on the cluster blueprint, which sums the cost properties of all related node entities.
Then, we can create a line chart displaying the cost property of the cluster entity over time, showing the total cost of the cluster.
The line chart will display data starting from the time the property was created.
Note that for aggregation (and calculation) properties, the data will be available from the time the aggregation property was created, and not the properties it is aggregating.
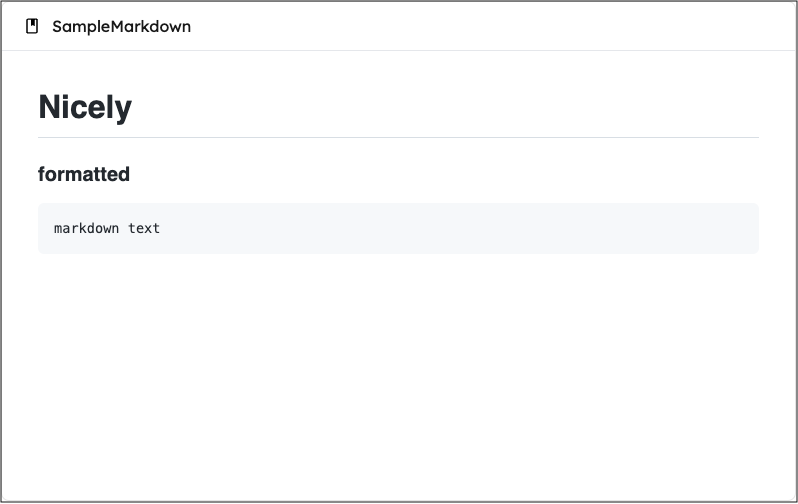
Markdown
This widget allows you to display any markdown content you wish in formatted form:
Markdown widget properties
| Field | Type | Description | Default | Required |
|---|---|---|---|---|
Title | String | Markdown widget title | null | true |
Icon | String | Markdown widget Icon | null | false |
markdown | String | Markdown content | null | false |
Iframe visualization
You can create an iframe widget to display an embedded url in the dashboard. The iframe widget is useful to display external dashboards or other external content. It also appends to the iframe URL query params the entity identifier and the blueprint identifier so the embedded page can use it for various purposes.
The entity identifier will be concatenated under the entity query param and the blueprint identifier will be concatenated under the blueprint query param. For example: https://some-iframe-url.com?entity=entity_identifier&blueprint=blueprint_identifier.
Widget properties
| Field | Type | Description | Default | Required |
|---|---|---|---|---|
Title | String | Iframe widget title | null | true |
Icon | String | Iframe widget Icon | null | false |
Description | String | Iframe widget description | null | false |
URL | String | Iframe widget url | null | false |
URL type | String | public or protect | null | false |
Authorization Url | URL String | If the URL type is protected this will be required. Read more about it here | null | false |
clientId | String | If the URL type is protected this will be required. Read more about it here | null | false |
Scopes | String Array | If the URL type is protected this will be required. Read more about it here | null | false |
Token URL | URL String | If the URL type is protected this will be required. Read more about it here | null | false |
Table
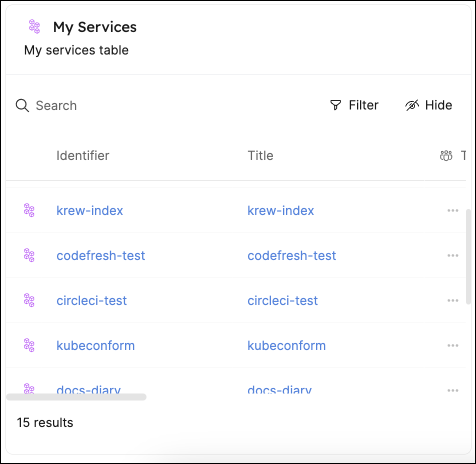
This widget allows you to create tables displaying all entities based on a selected blueprint.
Tables can be searched, filtered and customized as you wish, using the corresponding buttons in the widget.
Customization
Just like catalog pages, tables support the following customization options:
Action card
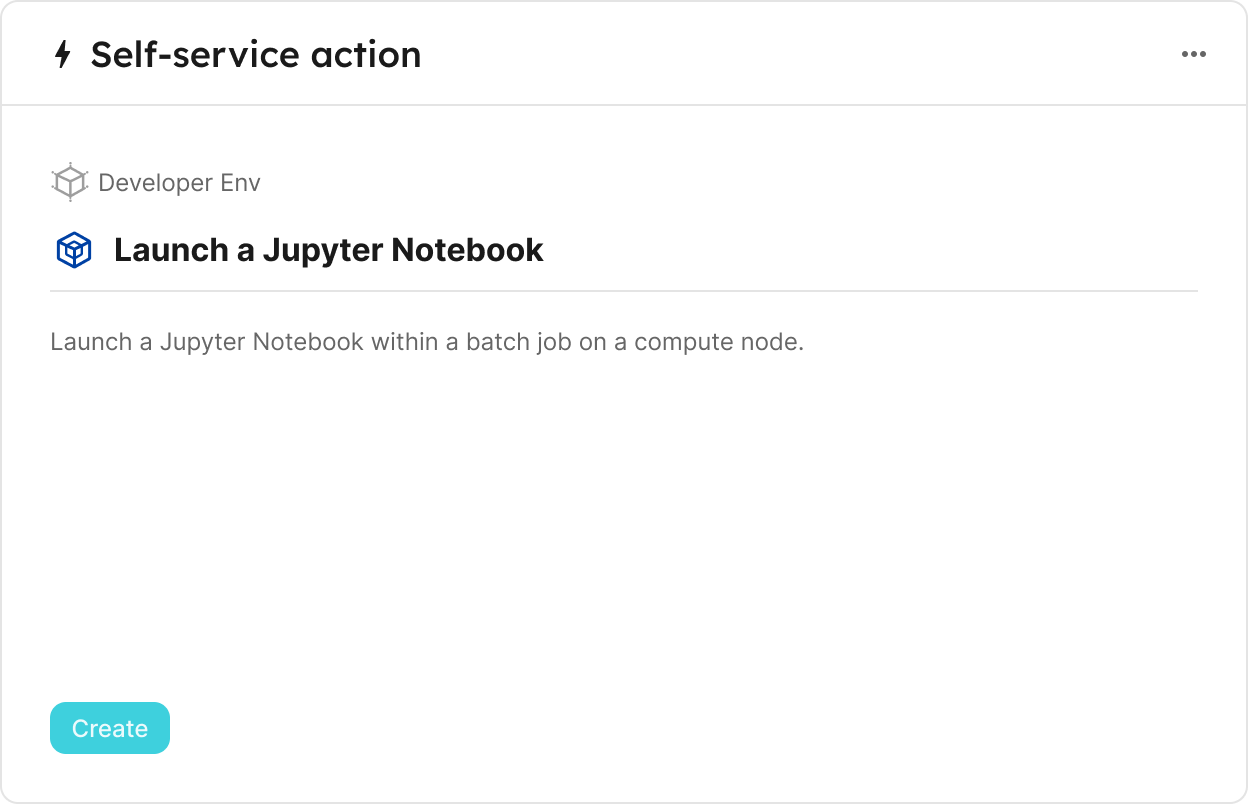
This widget allows you to execute self-service actions directly from any dashboard (including your homepage).
A single action card can contain one or multiple actions:
Single action
To execute the action, click on the button in the bottom left corner of the widget:
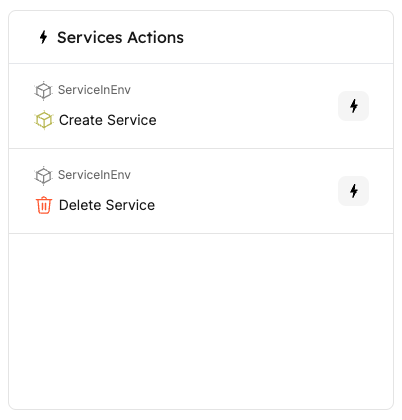
Multiple actions
When choosing multiple actions, you can choose your own title for the widget.
To execute an action, click on the ⚡ button next to it:
Action runs
This widget allows you to create a table displaying all past runs of a self-service action in your portal.
The table will automatically display data about each run, including status, input parameters, the executing user, and more.
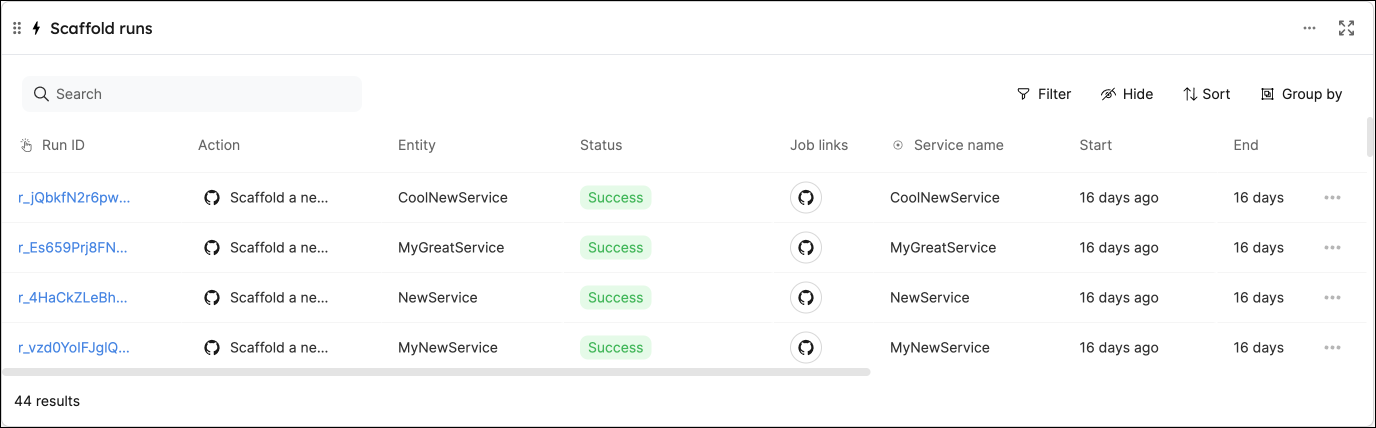
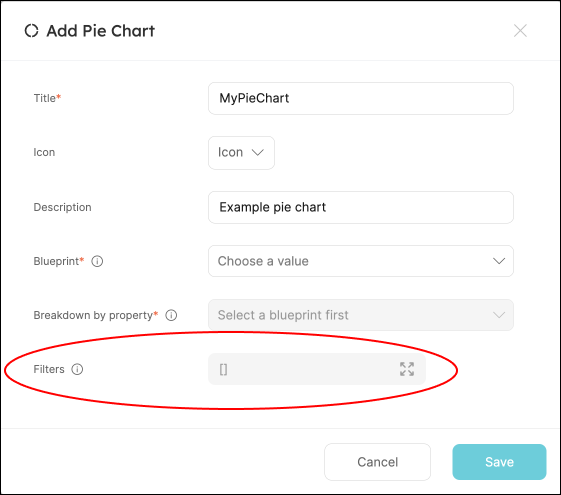
Chart filters
Pie charts, number charts and tables support filters, which allow you to include or exclude specific data from them. The filters are based on Port's Search Rules, and are set when creating the widget:
Filter example: only deployment entities from the last week
Let's assume we have a blueprint that is called Service which is related to another blueprint called Deployment, and we want to create visualizations on top of the last week's deployments of this service.
To achieve this desired state, we can go into one of the Service's profile pages and create a new visualization. After selecting the Deployment blueprint in the dropdown, we can add the following filter to the Filters array:
[
  {
    "property": "$createdAt",
    "operator": "between",
    "value": {
      "preset": "lastWeek"
    }
  }
]
Dynamic filters
You can use dynamic properties of the logged-in user when filtering a widget.
Widget type identifiers (Terraform)
When creating widgets using Port's Terraform provider, you need to provide the widget type's identifier in the type key.
The following table lists the identifiers for each widget type:
| Widget type | Identifier |
|---|---|
| Number chart | entities-number-chart |
| Pie chart | entities-pie-chart |
| Line chart | line-chart |
| Markdown | markdown |
| IFrame | iframe-widget |
| Table | table-entities-explorer |
| Action card | action-card-widget |
| Action History | action-runs-table-widget |
| My entities | my-entities |
| Recently viewed | recently-viewed-entities |
| Recently used actions | recently-used-actions |