Dashboard page
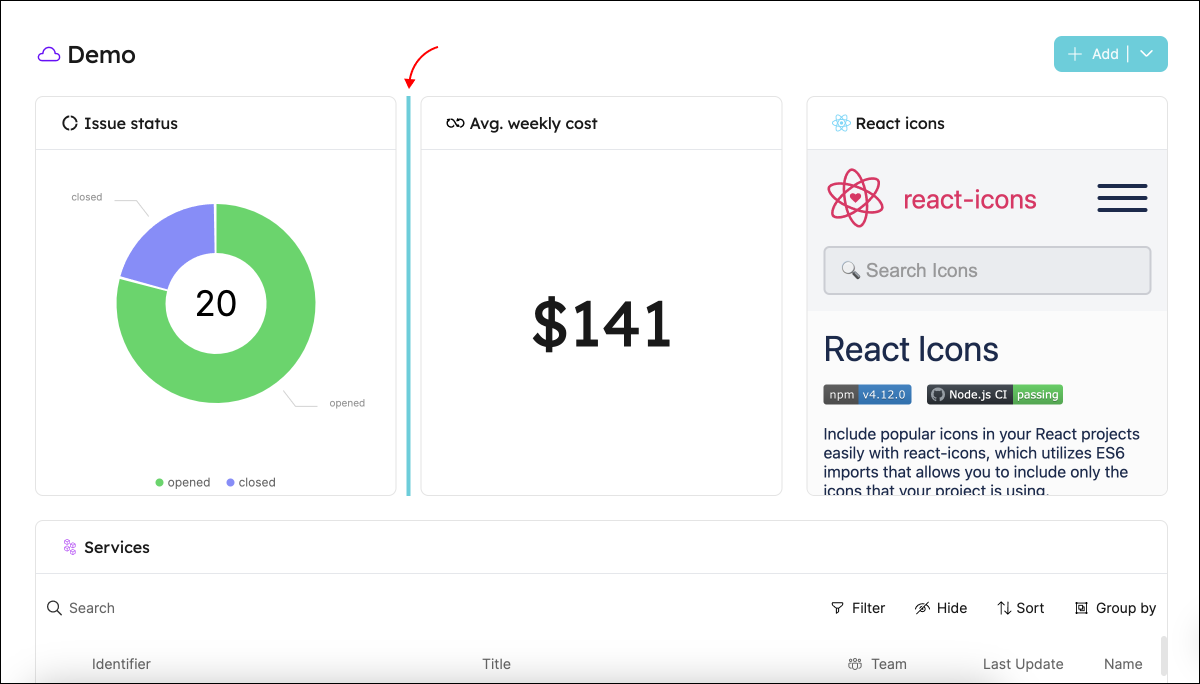
Dashboards are collections of widgets that allow you to display entity data using graphic elements:
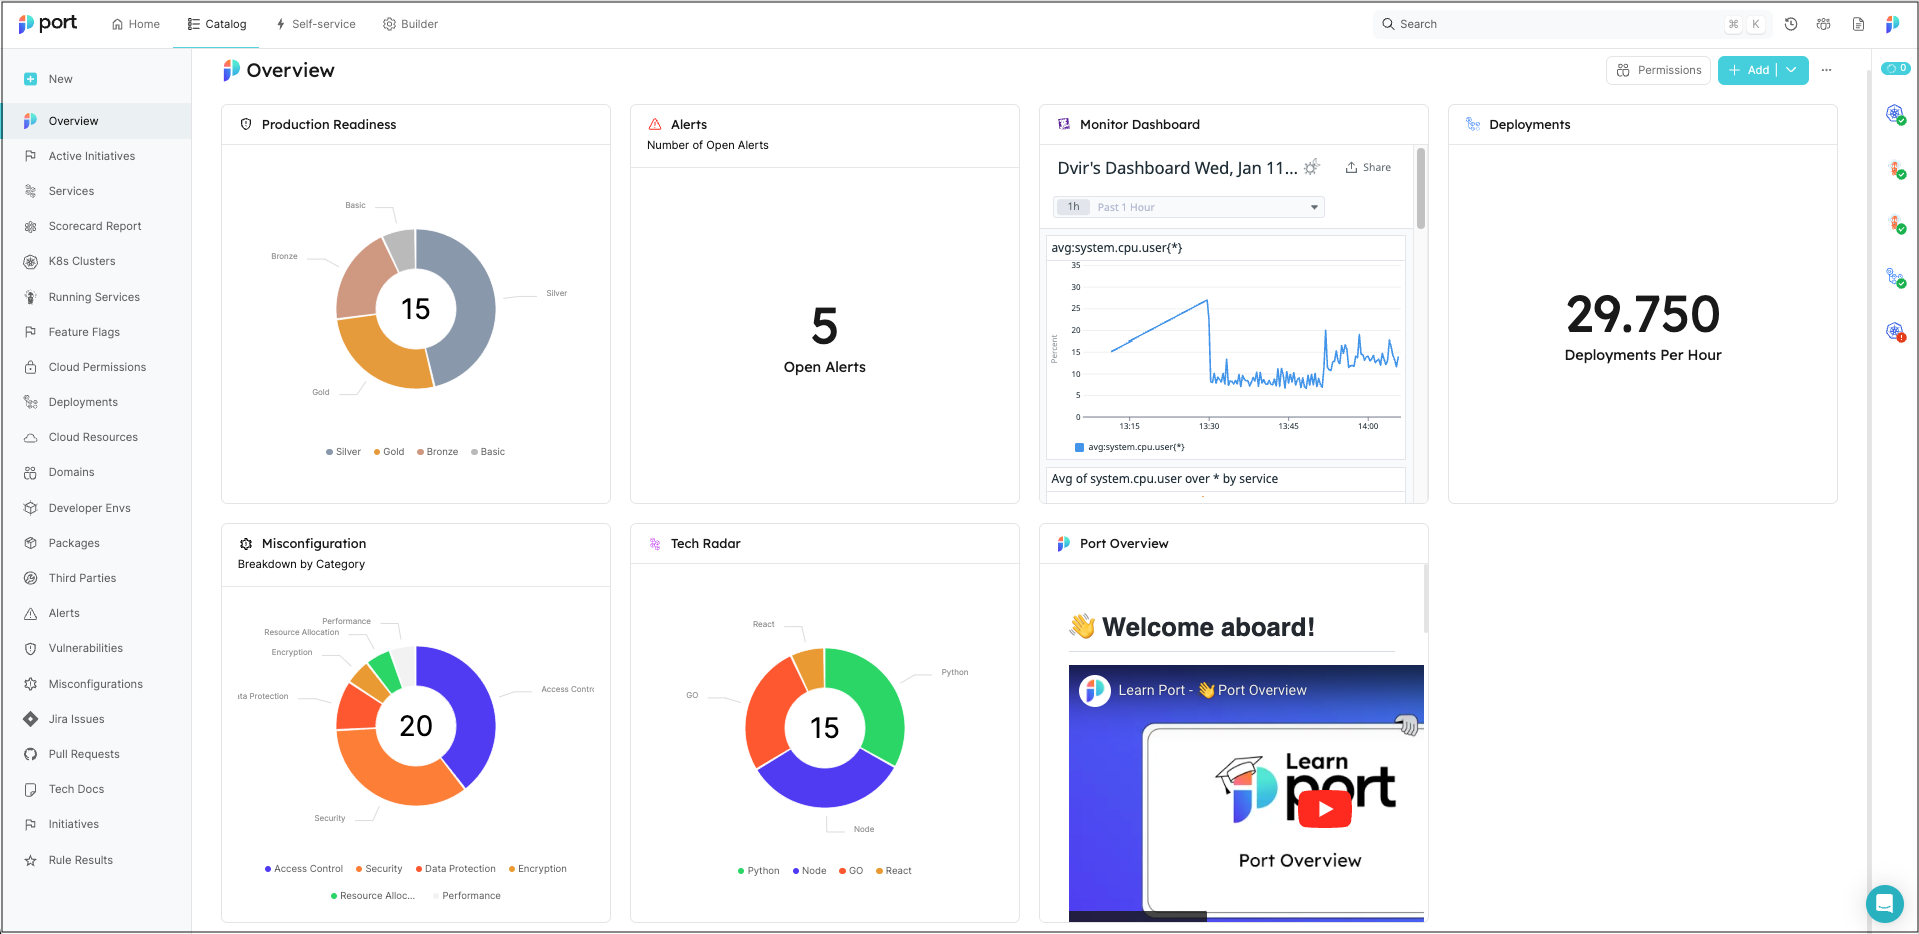
Similar to catalog pages, dashboards reside in the panel on the left-hand side of the software catalog.
Dashboards are a great way to display aggregated data and track the information that is relevant and/or interesting to you and your developers.
Creating a dashboard page
You can create as many dashboards as you'd like.
- From the UI
- From Pulumi
To create a dashboard, click on New and select New dashboard:

See all the supported variables in the Port Pulumi documentation
Introduction
This guide walks you through creating custom pages using our Pulumi provider. We'll cover:
- Widget Building Blocks: Creating the helper functions for generating different widget types.
- Dashboard Design: Composing widgets into layouts for your dashboard.
- Customization: Adapting the examples to your specific needs.
Prerequisites
- Basic Port Concepts: Familiarity with blueprints, entities, and datasets in your Port system is helpful.
- You will also need your Port credentials.
- This guide also assumes that you have installed Pulumi, and the Port provider's SDK in your chosen language.
- Python
- Typescript
- Let us create some helper functions. These will help to create the different kinds of widgets.
Widget Helper Functions
import json
from port_pulumi import Page

# Widget Helper Functions
def generate_widget_id(title, widget_type):
    """
    Generates a unique widget ID based on the title and widget type.

    Args:
        title (str): The title of the widget.
        widget_type (str): The type of the widget (e.g., "markdown", "table-entities-explorer").

    Returns:
        str: The generated widget ID, e.g., "microservicesGuideMarkdown".
    """
    # Convert title to camelCase
    title_words = title.split()
    camel_case_title = title_words[0].lower() + "".join(
        word.capitalize() for word in title_words[1:]
    )

    # Combine camelCase title and widget type
    base_id = f"{camel_case_title}{widget_type.capitalize()}"

    # Ensure the length does not exceed the limit
    max_length = len("QlUwO3VRBMQ3HjdH")
    return base_id[:max_length]

# Load markdown from a file helper function
def read_markdown_file(file_path):
    with open(file_path, "r", encoding="utf-8") as file:
        markdown_content = file.read()
        return markdown_content


def create_markdown_widget(title, description, markdown_content):
    """
    Creates a markdown widget configuration.

    Args:
        title (str): The title of the widget.
        subtitle (str): The subtitle of the markdown content.
        description (str): A description for the widget.

    Returns:
        tuple: A tuple containing:
            * widget_config (dict): The widget configuration dictionary.
            * widget_id (str): The generated widget ID.
    """
    widget_id = generate_widget_id(title, "markdown")
    widget_config = {
        "title": title,
        "icon": "BlankPage",
        "markdown": markdown_content,
        "type": "markdown",
        "description": description,
        "id": widget_id,
    }
    return widget_config, widget_id


def create_iframe_widget(title, url, url_type="public", description=""):
    widget_id = generate_widget_id(title, "iframe-widget")
    widget_config = {
        "title": title,
        "description": description,
        "icon": "Code",
        "urlType": url_type,
        "url": url,
        "type": "iframe-widget",
        "id": widget_id,
    }
    return widget_config, widget_id
- Now we can define the widgets in our dashboard and the layout of the page.
Dashboard Configuration
# ... (Rest of the Code: Helper Functions)

file_path = "microservices.md"  # Replace with the path to your Markdown file
markdown_content = read_markdown_file(file_path)

# Widget Creation (with IDs); we use the IDs to define the layout of the dashboard
markdown_config, markdown_id = create_markdown_widget(
    title="Service Guide",
    description="Services are typically organized around business capabilities. Each service is often owned by a single, small team.",
    markdown_content=markdown_content,
)

quote_config, quote_id = create_iframe_widget(
    title="Quote of the Day",
    url="https://kwize.com/quote-of-the-day/embed/&txt=0"
)

# Dashboard Layout Definition
dashboard_layout = {
    "id": "myDashboardWidget",  # This is optional, as Port can auto-generate IDs
    "type": "dashboard-widget",
    "layout": [
        {
            "columns": [
                {"id": markdown_id, "size": 6},
                {"id": quote_id, "size": 6},
            ],
            "height": 400,
        }
    ],
}

widgets_config = {
    **dashboard_layout,  # Embed the layout structure
    "widgets": [
        markdown_config,
        quote_config
    ],
}

print(widgets_config)
- Now we can define the page and run
pulumi upto create the page in Port.
Page Definition
import json
from port_pulumi import Page

// ... (Rest of the Code)

# Page Creation
microservice_dashboard_page = Page(
    "microservice-overview-page-resource",
    identifier="microservice_overview_page",
    title="Microservices Dashboard",
    icon="Microservice",
    type="dashboard",
    widgets=[json.dumps(widgets_config)],
)
- Let us now add helper functions to create dataset dependent widgets.
If you have not already, we recommend installing the GitHub app in order to get some data into your Port account. Subsequently, you can use the blueprints from this guide and follow along for tangible results.
More Widget Functions
# ... (Other helper functions)

def use_dataset(blueprint_id):
    """
    Creates a dataset configuration that filters entities based on the provided blueprint ID.

    Args:
        blueprint_id (str): The ID of the blueprint to filter for.

    Returns:
        dict: The dataset configuration dictionary.
    """
    return {  # Directly return the dataset
        "combinator": "and",
        "rules": [{"operator": "=", "value": blueprint_id, "property": "$blueprint"}],
    }


def create_table_explorer_widget(title, dataset, excludedFields=["properties.readme"]):
    widget_id = generate_widget_id(title, "table-entities-explorer")
    widget_config = {
        "displayMode": "widget",
        "title": title,
        "type": "table-entities-explorer",
        "dataset": dataset,
        "id": widget_id,
        "excludedFields": excludedFields,
    }
    return widget_config, widget_id


def create_entities_pie_chart_widget(title, dataset, property):
    widget_id = generate_widget_id(title, "entities-pie-chart")
    widget_config = {
        "title": title,
        "icon": "PieChart",
        "type": "entities-pie-chart",
        "dataset": dataset,
        "property": property,
        "id": widget_id,
    }
    return widget_config, widget_id


def create_entities_number_chart_widget(
    title,
    blueprint_id,
    dataset=[],
    func="average",
    measure_time_by="$createdAt",
    averageOf="day",
    description="",
):
    """
    Creates an entities number chart widget configuration.

    Args:
      title (str):  The title of the widget.
      dataset:  The dataset for the widget.
      func (str, optional): The aggregation function to use. Options: "average", "count", "sum". Defaults to "average".
      measure_time_by (str, optional): The property to use for time-based aggregations. Defaults to "$createdAt".
      averageOf (str, optional): The time period for averaging. Options: "day", "week", "month". Defaults to "day".
      description (str, optional): A description for the widget.

    Returns:
      tuple: A tuple containing the widget configuration dictionary and its ID.
    """

    widget_id = generate_widget_id(title, "entities-number-chart")
    widget_config = {
        "blueprint": blueprint_id,
        "calculationBy": "entities",
        "title": title,
        "description": description,
        "type": "entities-number-chart",
        "icon": "Calculator",
        "dataset": dataset,
        "func": func,
        "measureTimeBy": measure_time_by,
        "averageOf": averageOf,
        "unit": "custom",
        "unitCustom": "per day",
        "id": widget_id,
    }
    return widget_config, widget_id
- Let us now create dataset dependent widgets.
Dataset Widgets
# ... Sample Data & Widget Creation ...

# ... (Creation of markdownConfig e.t.c)

# Dataset configuration: `service` is the name of the blueprint in Port
services_dataset = use_dataset("service")

table_config, table_id = create_table_explorer_widget(
    title="Services",
    dataset=services_dataset,
    excludedFields=["properties.readme"],
)

pie_chart_config, pie_chart_id = create_entities_pie_chart_widget(
    title="Languages", dataset=services_dataset, property="property#language"
)

pr_chart_config, pr_chart_id = create_entities_number_chart_widget(
    title="Avg Pull Requests",
    blueprint_id="githubPullRequest",
    description="Hpw many PRs do we open daily",
)

# Dashboard Layout Definition
dashboard_layout = {
    "id": "myDashboardWidget",  # This is optional, as Port can auto-generate IDs
    "type": "dashboard-widget",
    "layout": [
        # previous configuration: markdown and quote widgets,
        {
            "height": 400,
            "columns": [
                {"id": pie_chart_id, "size": 6},
                {"id": pr_chart_id, "size": 6},
            ],
        },
        {"height": 400, "columns": [{"id": table_id, "size": 12}]},
    ],
}

widgets_config = {
    **dashboard_layout,  # Embed the layout structure
    "widgets": [
        markdown_config,
        quote_config,
        pie_chart_config,
        pr_chart_config,
        table_config
    ],
}

print(widgets_config)
- Now you can run the
pulumi upcommand again to update the page.
import * as pulumi from "@pulumi/pulumi";
import * as port from "@port-labs/port";
import * as fs from "fs"; // Assuming we use Node's 'fs' module for file reading

// ------------------ Widget Helper Functions ------------------

interface WidgetConfig {
  // Sample interface, adjust as needed
  id: string;
  title: string;
  type: string;
  icon?: string; // Optional properties
  description?: string;
  markdown?: string;
  blueprint?: string;
  displayMode?: string;
  dataset?: any;
  excludedFields?: string[];
  property?: string;
  calculationBy?: string;
  urlType?: string;
  // ... other widget properties
}

function generateWidgetId(title: string, widgetType: string): string {
  const titleWords = title.split(" ");
  const camelCaseTitle =
    titleWords[0].toLowerCase() +
    titleWords
      .slice(1)
      .map((word) => word)
      .join("");
  const baseId = `${camelCaseTitle}${widgetType}`;

  // Ensure the length does not exceed the limit
  const maxLength = 20; // Replace with the correct limit if needed
  return baseId.substring(0, maxLength);
}

function createMarkdownWidget(
  title: string,
  description: string,
  markdownContent: string
): [WidgetConfig, string] {
  const widgetId = generateWidgetId(title, "markdown");
  const widgetConfig: WidgetConfig = {
    title,
    icon: "BlankPage",
    markdown: markdownContent,
    type: "markdown",
    description,
    id: widgetId,
  };
  return [widgetConfig, widgetId];
}

function createTableExplorerWidget(
  title: string,
  dataset: any,
  excludedFields: string[] = ["properties.readme"]
): [WidgetConfig, string] {
  const widgetId = generateWidgetId(title, "table-entities-explorer");
  const widgetConfig: WidgetConfig = {
    displayMode: "widget", // Assuming  this property exists
    title,
    type: "table-entities-explorer",
    dataset,
    id: widgetId,
    excludedFields,
  };
  return [widgetConfig, widgetId];
}

function createEntitiesPieChartWidget(
  title: string,
  dataset: any,
  property: string
): [WidgetConfig, string] {
  const widgetId = generateWidgetId(title, "entities-pie-chart");
  const widgetConfig = {
    title,
    icon: "PieChart",
    type: "entities-pie-chart",
    dataset,
    property,
    id: widgetId,
  };
  return [widgetConfig, widgetId];
}

function createIframeWidget(
  title: string,
  url: string,
  urlType: string = "public",
  description: string = ""
): [WidgetConfig, string] {
  const widgetId = generateWidgetId(title, "iframe-widget");
  const widgetConfig = {
    title,
    description,
    icon: "Code",
    urlType,
    url,
    type: "iframe-widget",
    id: widgetId,
  };
  return [widgetConfig, widgetId];
}

function createEntitiesNumberChartWidget(
  title: string,
  blueprintId: string,
  dataset: any = [],
  func: "average" | "count" | "sum" = "average",
  measureTimeBy: string = "$createdAt",
  averageOf: "day" | "week" | "month" = "day",
  description: string = ""
): [WidgetConfig, string] {
  const widgetId = generateWidgetId(title, "entities-number-chart");
  const widgetConfig = {
    blueprint: blueprintId,
    calculationBy: "entities",
    title,
    description,
    type: "entities-number-chart",
    icon: "Calculator",
    dataset,
    func,
    measureTimeBy,
    averageOf,
    unit: "custom",
    unitCustom: "per day",
    id: widgetId,
  };
  return [widgetConfig, widgetId];
}

// ------------------ Other Helper Functions ------------------

function readMarkdownFile(filePath: string): string {
  return fs.readFileSync(filePath, "utf-8");
}

function useDataset(blueprintId: string): any {
  // Type may vary depending on your provider
  return {
    combinator: "and",
    rules: [{ operator: "=", value: blueprintId, property: "$blueprint" }],
  };
}

// ------------------ Sample Data & Widget Creation ------------------

const servicesDataset = useDataset("service");
const githubPrDataset = useDataset("githubPullRequest");

const filePath = "microservices.md";
const markdownContent = readMarkdownFile(filePath);

const [markdownConfig, markdownId] = createMarkdownWidget(
  "Service Guide",
  "Services are typically organized around business capabilities...",
  markdownContent
);

// Table Explorer Widget
const [tableConfig, tableId] = createTableExplorerWidget(
  "Services",
  servicesDataset,
  ["properties.readme", "properties.slack"]
);

// Entities Pie Chart Widget
const [pieChartConfig, pieChartId] = createEntitiesPieChartWidget(
  "Languages",
  servicesDataset,
  "property#language"
);

// Iframe Widget
const [quoteConfig, quoteId] = createIframeWidget(
  "Quote of the Day",
  "https://kwize.com/quote-of-the-day/embed/&txt=0"
);

// Entities Number Chart Widget
const [prChartConfig, prChartId] = createEntitiesNumberChartWidget(
  "Avg Pull Requests",
  "githubPullRequest",
  githubPrDataset,
  "average",
  "$createdAt",
  "day",
  "How many PRs do we open daily?"
);

// ------------------ Dashboard Layout ------------------

const dashboardLayout = {
  id: "myDashboardWidget", // Optional
  type: "dashboard-widget",
  layout: [
    {
      // Row 1
      columns: [
        { id: markdownId, size: 6 }, // Markdown Widget (half width)
        { id: pieChartId, size: 6 }, // Pie Chart Widget (half width)
      ],
      height: 400,
    },
    {
      // Row 2
      columns: [
        { id: quoteId, size: 12 }, // Quote Widget (half width)
        { id: prChartId, size: 6 }, // PR Chart Widget (half width)
      ],
      height: 400,
    },
    {
      // Row 3
      columns: [
        { id: tableId, size: 12 }, // Table Widget (full width)
      ],
      height: 400,
    },
  ],
};

const widgetsConfig = {
  ...dashboardLayout,
  widgets: [
    markdownConfig,
    pieChartConfig,
    quoteConfig,
    prChartConfig,
    tableConfig,
  ],
};

// ------------------ Page Creation ------------------

export const microserviceDashboardPage = new port.Page(
  "microservice-overview-page-resource",
  {
    identifier: "microservice_overview_page",
    title: "Microservices Dashboard",
    icon: "Microservice",
    type: "dashboard",
    widgets: [JSON.stringify(widgetsConfig)],
  }
);
Description
You can provide additional context to your developers by using the Description field when creating a dashboard page.
This field supports adding links in markdown format: [link text](https://www.address.com).
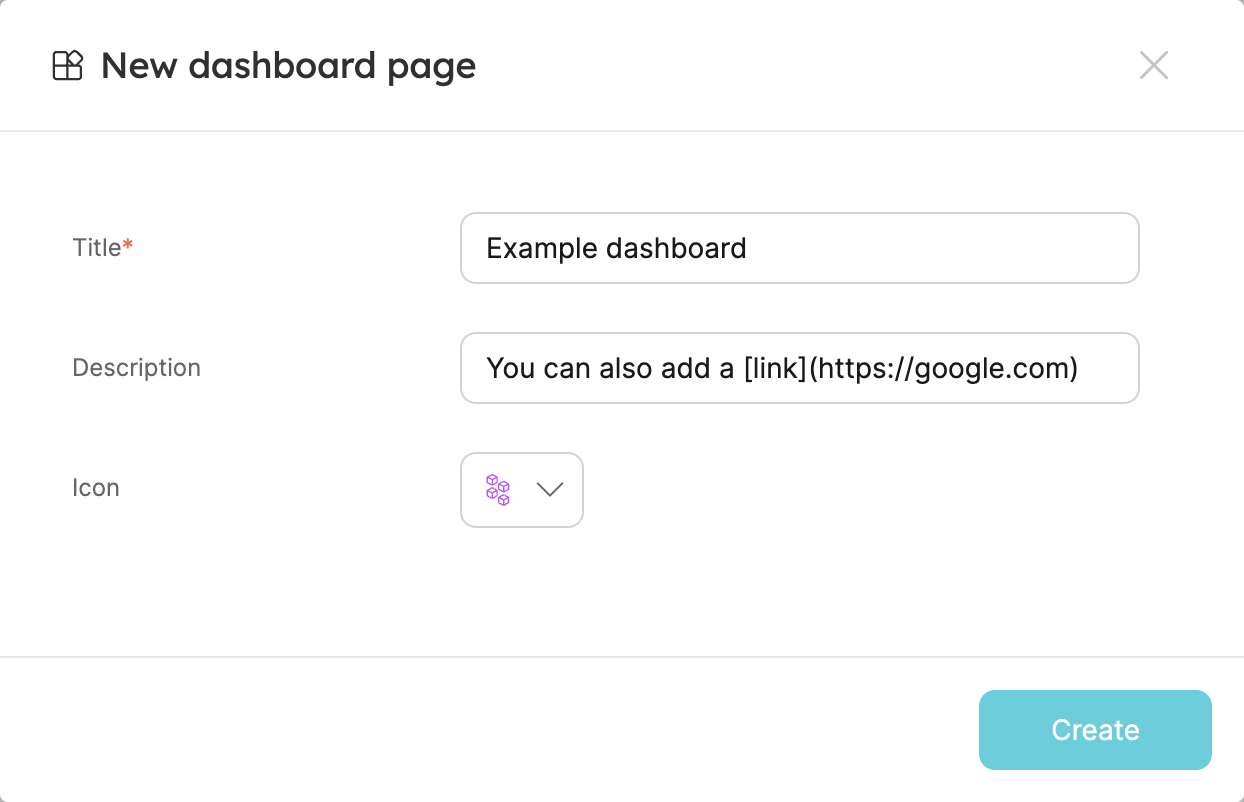
The description will be displayed at the top of the page, under the page title:

Adding new widgets
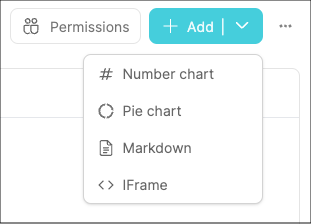
A dashboard can include any of the supported widgets.
To add a new widget, click Add and choose your desired visualization type:
Reordering and resizing widgets
Widgets can be expanded and/or moved within a dashboard page.
To move a widget, drag it from the top-left corner to your desired position:
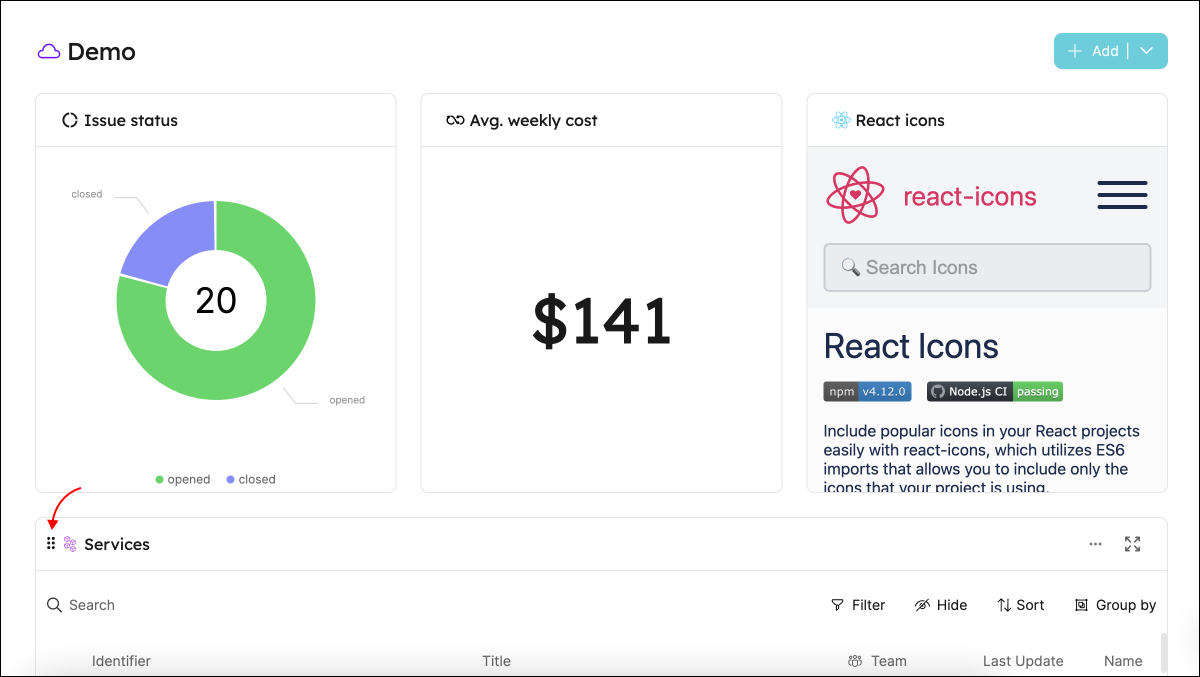
To resize a widget, hover over one of its sides until the blue bar appears, then drag it to expand/shrink:
