Visualize your services' k8s runtime
This guide takes 10 minutes to complete, and aims to demonstrate the value of Port's integration with Kubernetes.
- This guide assumes you have a Port account and that you have finished the onboarding process. We will use the
Serviceblueprint that was created during the onboarding process. - You will need an accessible k8s cluster. If you don't have one, here is how to quickly set-up a minikube cluster.
- Helm - required to install Port's Kubernetes exporter.
The goal of this guide
In this guide we will model and visualize our services' Kubernetes resources.
After completing it, you will get a sense of how it can benefit different personas in your organization:
- Developers will be able to easily view the health and status of their services' K8s runtime.
- Platform engineers will be able to create custom views and visualizations for different stakeholders in the organization.
- Platform engineers will be able to set, maintain and track standards for K8s resources.
- R&D managers will be able to track any data about services' K8s resources, using tailor-made views and dashboards.
Install Port's Kubernetes exporter
-
Go to your data sources page, click on
+ Data source, find theKubernetes Stackcategory and selectKubernetes: -
Copy the installation command after specifying your cluster's name, it should look something like this:
# The following script will install a K8s integration at your K8s cluster using helm
# Change the stateKey to describe your integration.
# For example, the name of the cluster it will be installed on.
helm repo add --force-update port-labs https://port-labs.github.io/helm-charts
helm upgrade --install my-cluster port-labs/port-k8s-exporter \
  --create-namespace --namespace port-k8s-exporter \
	--set secret.secrets.portClientId="YOUR_PORT_CLIENT_ID"  \
	--set secret.secrets.portClientSecret="YOUR_PORT_CLIENT_SECRET"  \
	--set portBaseUrl="https://api.getport.io"  \
	--set stateKey="my-cluster"  \
	--set eventListener.type="POLLING"  \
	--set "extraEnv[0].name"="CLUSTER_NAME"  \
	--set "extraEnv[0].value"="my-cluster"
The baseUrl, port_region, port.baseUrl, portBaseUrl, port_base_url and OCEAN__PORT__BASE_URL parameters are used to select which instance or Port API will be used.
Port exposes two API instances, one for the EU region of Port, and one for the US region of Port.
- If you use the EU region of Port, available at https://app.getport.io, your Port API URL is
https://api.getport.io - If you use the US region of Port, available at https://app.us.getport.io, your Port API URL is
https://api.us.getport.io
What does the exporter do?
After installation, the exporter will:
- Create blueprints in your Builder (as defined here) that represent Kubernetes resources:

Workload is an abstraction of Kubernetes objects which create and manage pods (e.g. Deployment, StatefulSet, DaemonSet).
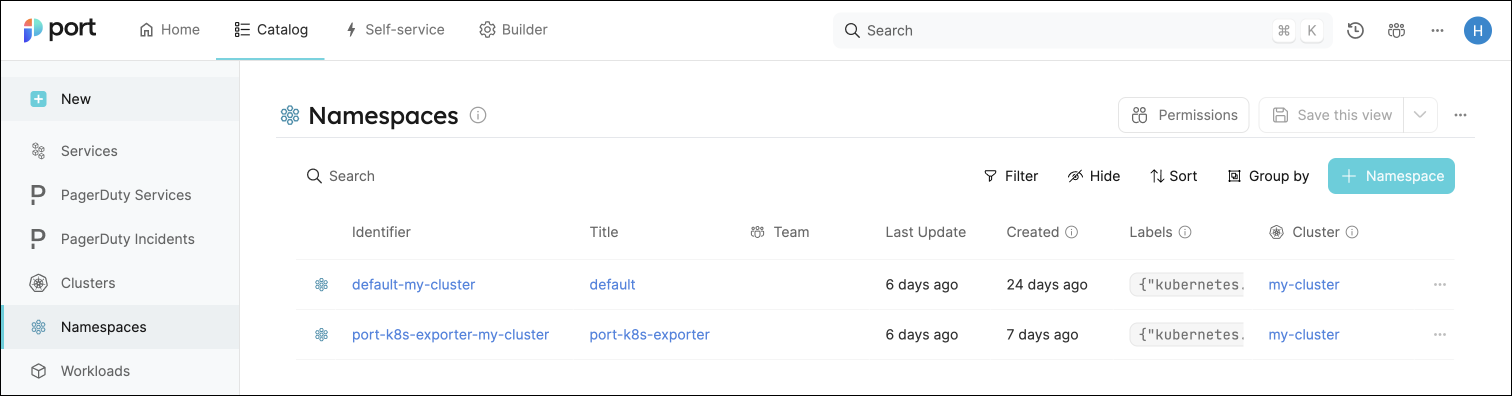
- Create entities in your Software catalog. You will see a new page for each blueprint containing your resources, filled with data from your Kubernetes cluster (according to the default mapping that is defined here):
-
Create scorecards for the blueprints that represent your K8s resources (as defined here). These scorecards define rules and checks over the data ingested from your K8s cluster, making it easy to check that your K8s resources meet your standards.
-
Create dashboards that provide you with a visual view of the data ingested from your K8s cluster.
-
Listen to changes in your Kubernetes cluster and update your entities accordingly.
Define the connection between services and workloads
Now that we have our blueprints set up, we want to model the logical connection between them by relating the Workload blueprint to the Service blueprint. This will grant us some helpful context in our Software catalog, allowing us to see relevant Workloads in a Service's context, or a Service's property directly in its corresponding Workload.
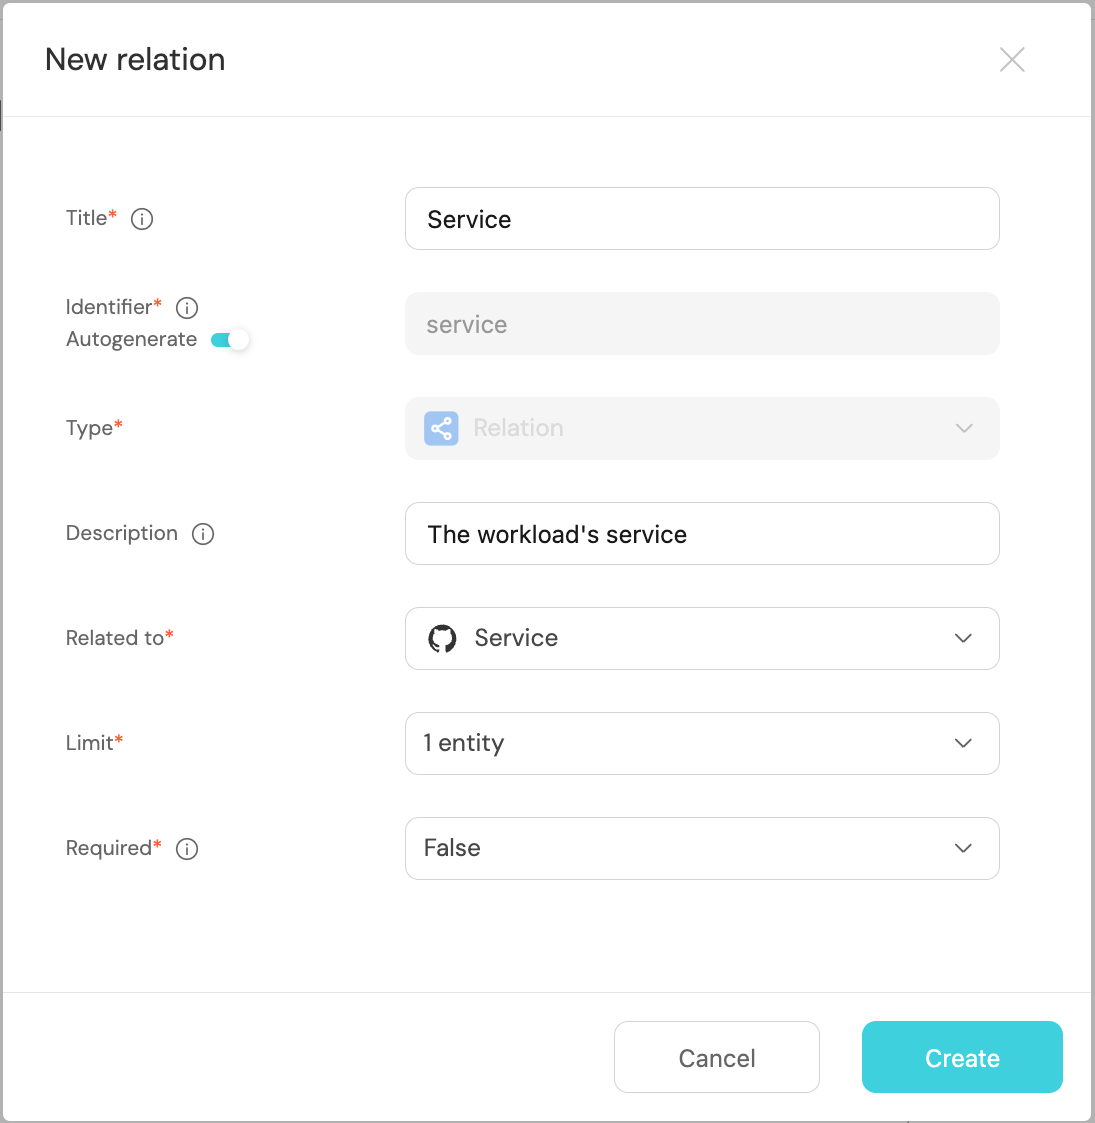
In this guide we will create one relation named service which will represent the service that a workload is running.
-
Go to your Builder, expand the
Workloadblueprint, and click onNew relation. -
Fill out the form like this, then click
Create:
Map your workloads to their services
You may have noticed that the service relations are empty for all of our workloads. This is because we haven't specified which workload belongs to which service. This can be done manually, or via mapping by using a convention of your choice.
In this guide we will use the following convention:
A workload with a label in the form of portService: <service-identifier> will automatically be assigned to a service with that identifier.
For example, a k8s deployment with the label portService: myService will be assigned to a service with the identifier myService.
We achieved this by adding a mapping definition in the configuration YAML we used when installing the exporter. The definition uses jq to perform calculations between properties.
Let's see this in action:
- Create a
Deploymentresource in your cluster with a label matching the identifier of aservicein your Software catalog.
You can use the simple example below and change themetadata.labels.portServicevalue to match your desiredservice. Copy it into a file nameddeployment.yaml, then apply it:
kubectl apply -f deployment.yaml
Deployment example (Click to expand)
apiVersion: apps/v1
kind: Deployment
metadata:
  name: awesomeservice
  labels:
    app: nginx
    portService: AwesomeService
spec:
  replicas: 2
  selector:
    matchLabels:
      app: nginx
  template:
    metadata:
      labels:
        app: nginx
    spec:
      containers:
        - name: nginx
          image: nginx:1.14.2
          ports:
            - containerPort: 80
- To see the new data, we need to update the mapping configuration that the K8s exporter uses to ingest data.
To edit the mapping, go to your data sources page, find the K8s exporter card, click on it and you will see a YAML editor showing the current configuration.
Add the following block to the mapping configuration and clickResync:
resources:
  # ... Other resource mappings installed by the K8s exporter
  - kind: apps/v1/deployments
    selector:
      query: .metadata.namespace | startswith("kube") | not
    port:
      entity:
        mappings:
        - blueprint: '"workload"'
          icon: '"Deployment"'
          identifier: .metadata.name + "-Deployment-" + .metadata.namespace + "-" +
            "my-cluster"
          properties: {}
          relations:
            service: .metadata.labels.portService
          title: .metadata.name
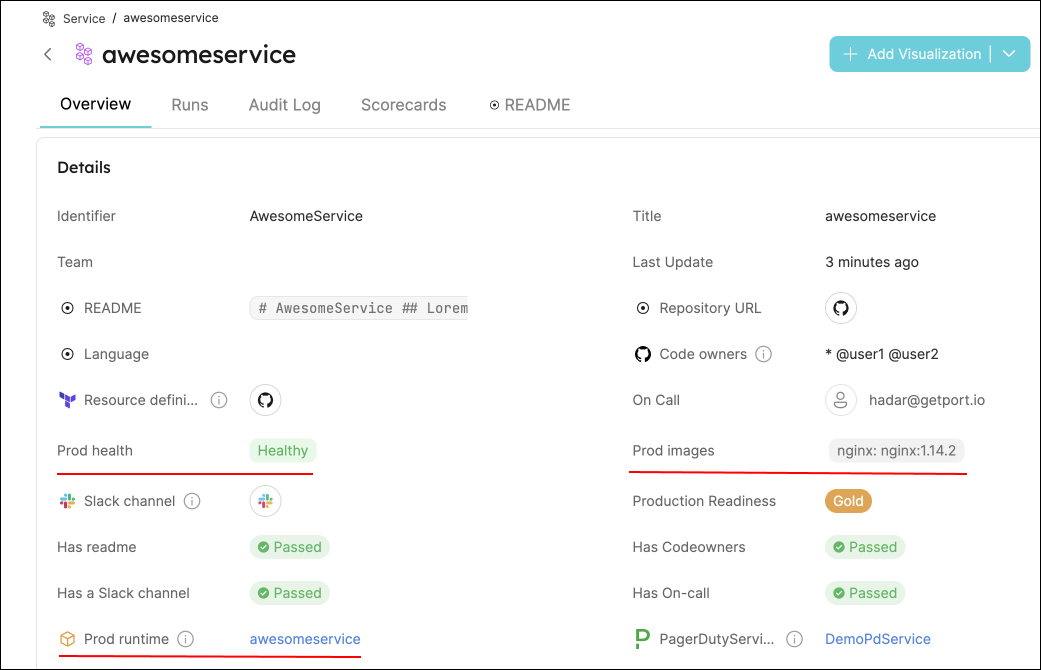
- Go to your Software catalog, and click on
Workloads. Click on theWorkloadfor which you created the deployment, and you should see theservicerelation filled.
Visualize data from your Kubernetes environment
We now have a lot of data about our workloads, and some metrics to track their quality. Let's see how we can visualize this information in ways that will benefit the routine of our developers and managers.
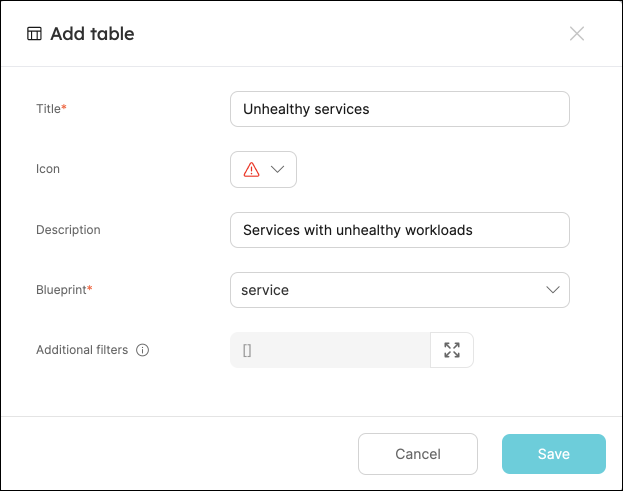
Add an "Unhealthy services" table to your homepage
In the configuration provided for this guide, a workload is considered Healthy if its defined number of replicas is equal to its available replicas (of course, you can change this definition).
-
Go to your homepage, click on the
+ Addbutton in the top right corner, then selectTable. -
Fill the form out like this, then click
Save:
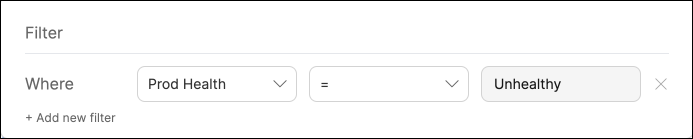
- In your new table, click on
Filter, then on+ Add new filter. Fill out the fields like this:
Now you can keep track of services that need your attention right from your homepage.
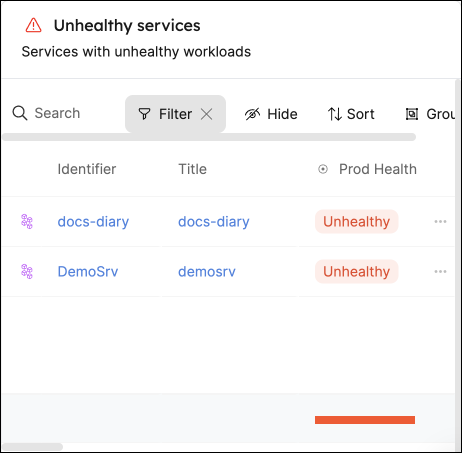
These services were not included in this guide, but serve to show an example of how this table might look.
Use your scorecards to get a clear overview of your workloads' availability
In the configuration provided for this guide, the availability metric is defined like this:
- Bronze: >=1 replica
- Silver: >=2 replicas
- Gold: >=3 replicas
To get an overall picture of our workloads' availability, we can use a table operation.
-
Go to the
Workloadscatalog page. -
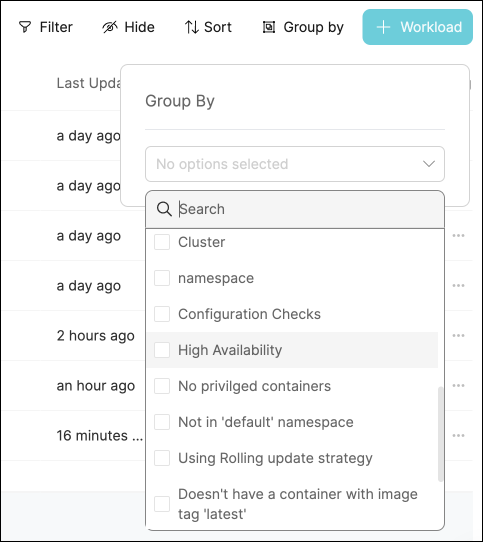
Click on the
Group bybutton, then chooseHigh availabilityfrom the dropdown:
- Click on any of the metric levels to see the corresponding workloads:
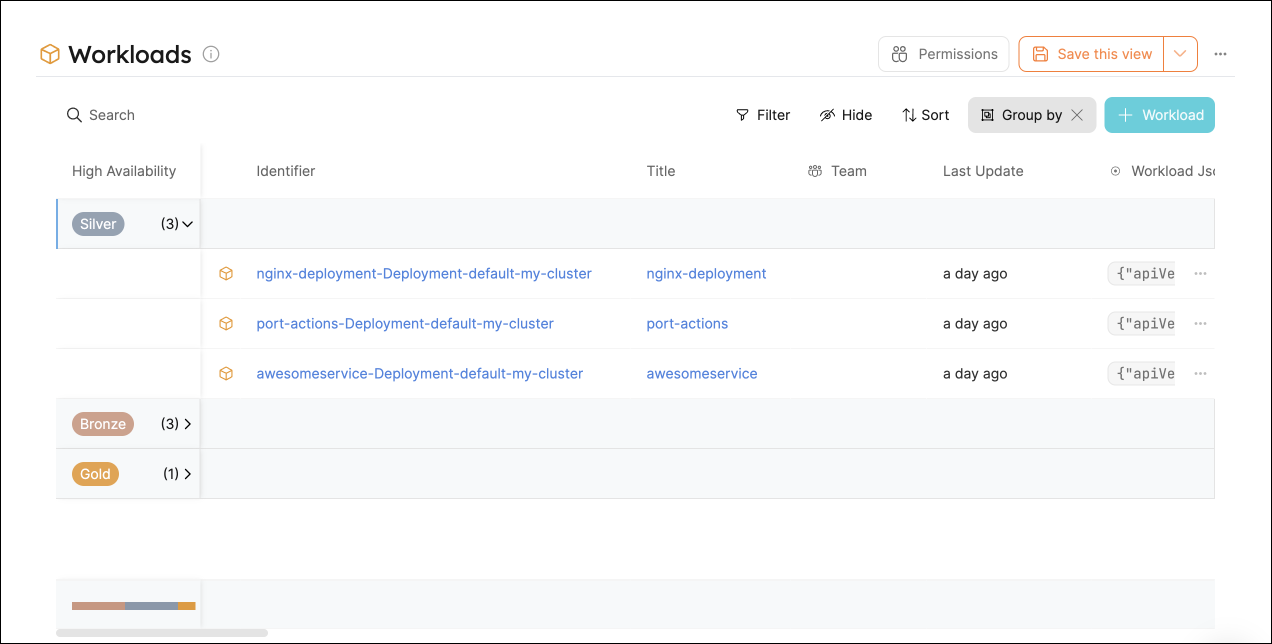
Note that you can also set this as the default view by click on the Save this view button 📝
Possible daily routine integrations
- Send a slack message in the R&D channel to let everyone know that a new deployment was created.
- Notify Devops engineers when a service's availability drops.
- Send a weekly/monthly report to R&D managers displaying the health of services' production runtime.
Conclusion
Kubernetes is a complex environment that requires high-quality observability. Port's Kubernetes integration allows you to easily model and visualize your Kubernetes resources, and integrate them into your daily routine.
Customize your views to display the data that matters to you, grouped or filtered by teams, namespaces, or any other criteria.
With Port, you can seamlessly fit your organization's needs, and create a single source of truth for your Kubernetes resources.
More guides & tutorials will be available soon, in the meantime feel free to reach out with any questions via our community slack or Github project.