Embedded URL
The embedded URL property is used to embed and display a webpage within an entity in Port.
Using this property will automatically create an additional tab in each entity page, displaying the embedded content.
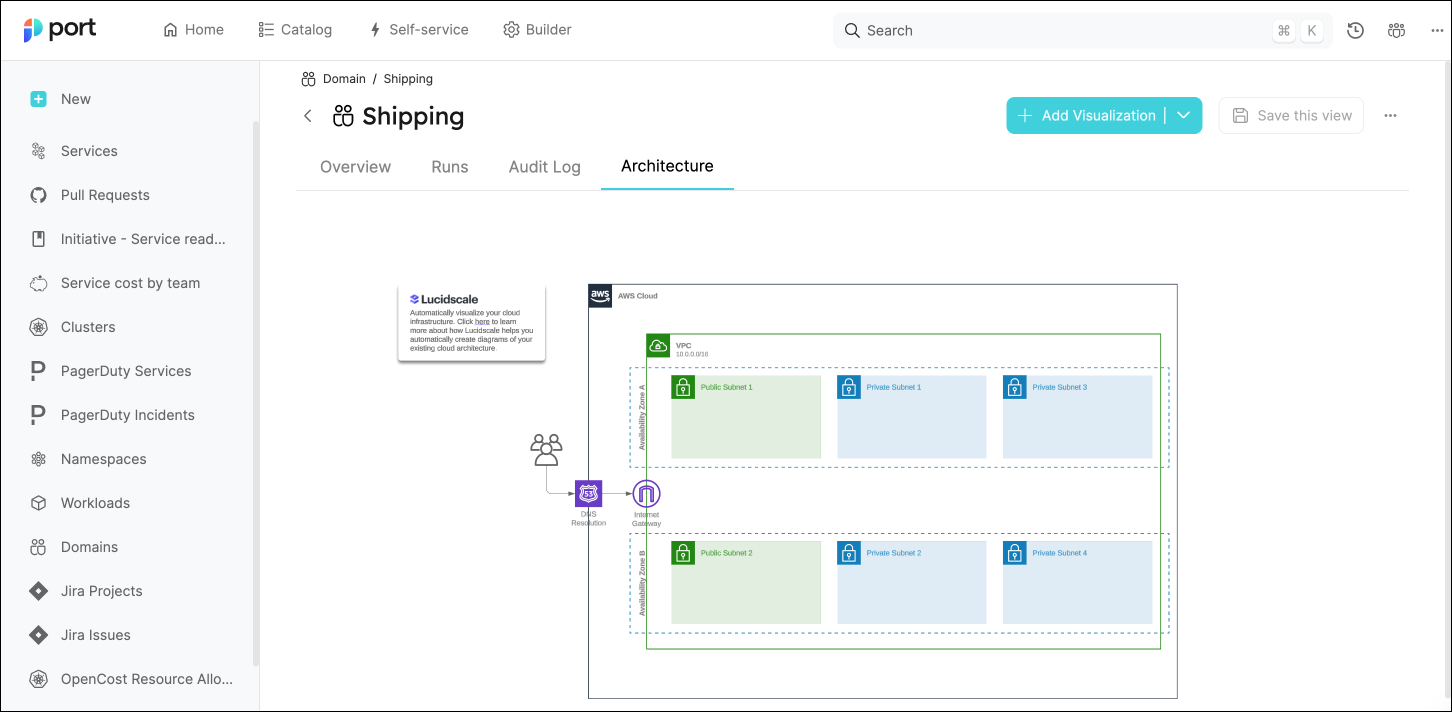
In the following example, we see the Shipping entity page, which is an instance on the Domain blueprint.
The blueprint has an embedded URL property named Architecture, which is automatically displayed in a dedicated tab:

URL type
Port supports the following URL types:
- Public link - A link to a public webpage, which does not require authentication.
- Private link - A link to a webpage that is protected by SSO authentication. To use this type, you'll need to provide the required parameters, see the authentication section for more information and examples.
💡 Common embedded URL usage
- Display a service's architecture
- Display & track a service's Datadog dashboard
- Display charts and diagrams from external tools
Schema definition
- API
- Terraform
{
  "myEmbeddedUrl": {
    "title": "My Embedded URL",
    "type": "string",
    "format": "url",
    "spec": "embedded-url",
    "description": "embedded-url Prop",
    // specAuthentication is needed only when using a protected/private URL
    "specAuthentication": {
        "authorizationUrl": "https://app.com",
        "tokenUrl": "https://app.com",
        "clientId": "1234",
        "authorizationScope": [
          "api://xxxx-xxxx-xxxx-xxxx-xxxx/user.read"
        ]
      }

  }
}
resource "port_blueprint" "myBlueprint" {
  # ...blueprint properties
  properties {
    identifier = "myEmbeddedUrl"
    title      = "My Embedded URL"
    required   = false
    type       = "string"
    format     = "url"
    spec       = "embedded-url"
  }
}
Examples
Datadog dashboard
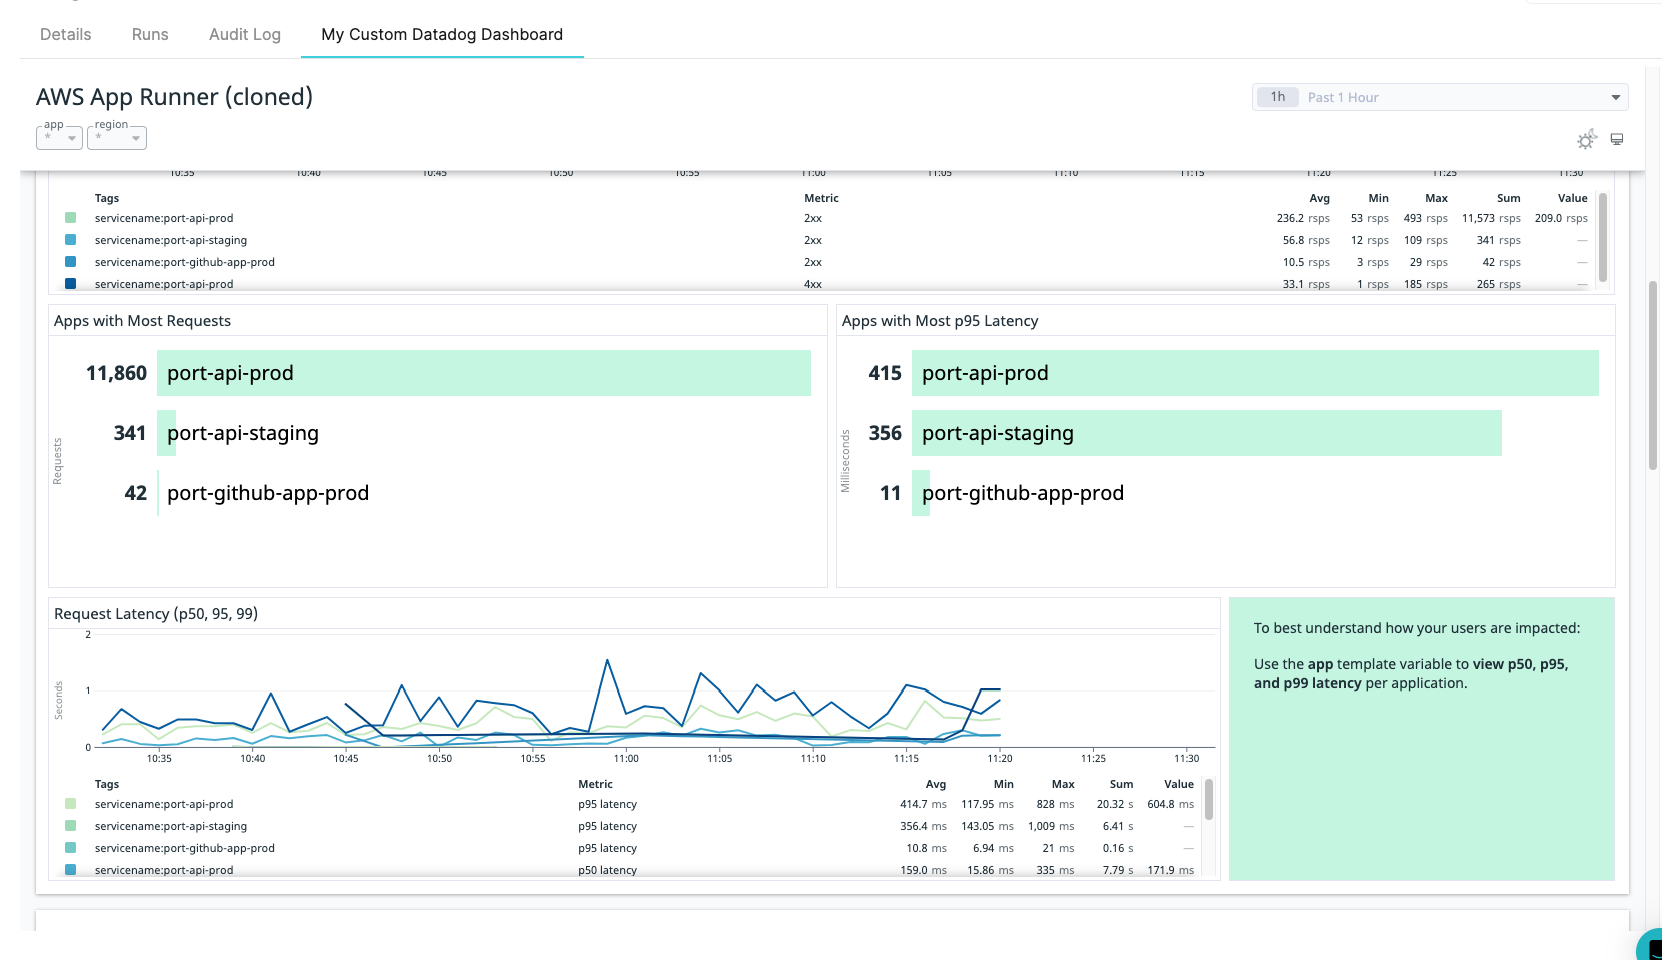
In this example we are embedding a Datadog dashboard in order to get application metrics directly inside Port.
Add the embedded-URL property to a Blueprint:
Blueprint property definition
{
  "datadog": {
    "title": "Datadog",
    "type": "string",
    "format": "url",
    "spec": "embedded-url"
  }
}
Create or edit an Entity of the Blueprint you added the Datadog property to, and specify the URL to the Datadog dashboard:
Now go to the specific entity page of your Entity and the Datadog dashboard will be visible in a dedicated tab:

New Relic Chart
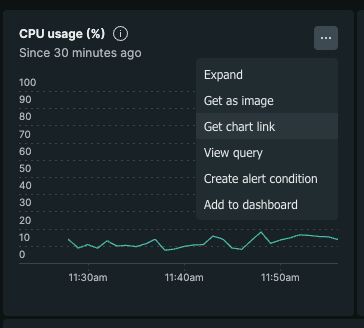
In this example we are embedding a CPU usage New Relic Chart to get infrastructure metrics directly inside Port.
Add the embedded-URL property to a Blueprint:
Blueprint property definition
{
  "cpuUsage": {
    "type": "string",
    "title": "CPU usage",
    "spec": "embedded-url",
    "format": "url"
  }
}
Go to new relic and extract the chart URL of a specific chart

Create or edit an Entity of the Blueprint you added the cpuUsage property to, and specify the URL to the CPU Usage chart:

Now go to the specific entity page of your Entity and the CPU Usage chart will be visible in a dedicated tab:
